Root Cause Analysis (RCA): The Complete Guide for IT & SRE Teams
Root cause analysis (RCA) is a structured process for identifying the underlying condition that caused an incident, rather than just the symptom that made it visible.
Quick Answer: In IT and SRE contexts, RCA answers "why did this happen" so a team can fix the actual failure point instead of the thing that happened to break first. It typically follows a defined process (define the problem, gather evidence, generate hypotheses, test them, confirm the cause, assign corrective action), uses techniques like the 5 Whys or fishbone diagrams to get there, and increasingly relies on automated correlation across logs, metrics, and deploy history to cut investigation time from hours to minutes.
Key Takeaways
RCA is not the same thing as a postmortem: RCA is the "why," a postmortem is the "what, why, and what next" — RCA is one section inside a postmortem, not a replacement for it.
Most production incidents have several contributing factors, not one single root cause. Teams that stop at the first plausible explanation usually end up writing the same postmortem again in three months.
The 5 Whys technique is fast and cheap but breaks down on complex, multi-system failures — that's where fishbone diagrams and fault tree analysis earn their keep.
Manual RCA doesn't scale past a handful of services. Once you're correlating logs, metrics, deploys, and on-call schedules across a distributed system, the bottleneck shifts from "do we know how to investigate" to "how fast can a human read enough context to form a hypothesis."
What Is Root Cause Analysis?
Root cause analysis is the practice of tracing a problem backward from its visible symptom to the specific condition that made the symptom possible — and then fixing that condition instead of the symptom.
The distinction matters because symptoms and root causes look identical when you're moving fast during an incident. "The API is returning 500s" is a symptom. "The connection pool was sized for the traffic pattern from eight months ago and silently exhausted itself under this week's load" is closer to a root cause. Restarting the service fixes the symptom. Resizing the pool — or better, adding a scaling policy so nobody has to remember to resize it again — fixes the root cause.
RCA didn't originate in software. It comes from manufacturing and safety-critical industries (aviation, nuclear, healthcare), where a missed root cause doesn't just mean a repeat outage — it means a repeat accident. The core discipline transfers directly to production systems: a database failover that isn't investigated properly today is a 3 AM page again next quarter.
RCA vs. Postmortem vs. Contributing Factor Analysis
These three terms get used interchangeably and shouldn't be:
Root cause analysis is the specific activity of tracing what broke and why. It produces one or more root causes.
Postmortem (or post-incident review) is the full document: timeline, impact, root cause analysis, contributing factors, what went well, and action items. RCA is a section inside it, not a synonym for it.
Contributing factor analysis looks at everything that had to be true for the incident to unfold the way it did — including things that aren't "causes" in a strict sense. A missing alert, an undocumented runbook, or an on-call engineer being new to the service are contributing factors. They didn't cause the outage, but fixing them prevents the next one from being just as bad.
A useful mental model: root cause analysis tells you what broke. Contributing factor analysis tells you why it was able to break without anyone catching it earlier.
Root Cause Analysis | Postmortem | Contributing Factor Analysis | |
|---|---|---|---|
Answers | Why did the failure happen? | What happened, why, and what's next? | What conditions let it happen the way it did? |
Scope | One section of the investigation | The full document: timeline, impact, RCA, action items | A supplement to RCA, not a replacement |
Output | One or more root causes | A shared record of the incident | A list of conditions to fix (alerts, docs, gaps) |
Typical length | A few paragraphs or a diagram | Several pages | A short list |
The Root Cause Analysis Process
A structured RCA follows roughly the same sequence regardless of whether the incident is a payment outage or a factory line stoppage. The steps below are the manufacturing-origin process translated into an IT incident context.
1. Define the problem precisely. "The site was slow" isn't a problem statement — it's a symptom description. A usable RCA starts with something closer to: "Checkout API p95 latency exceeded 4 seconds for 23 minutes starting at 14:02 UTC, affecting an estimated 6% of checkout attempts." Specificity here saves hours later, because a vague problem statement invites a vague investigation.
2. Reconstruct the timeline. Pull the sequence of events from monitoring, deploy logs, and alert history: what changed, in what order, before the first symptom appeared. This is the step most incident management platforms exist to automate — manually stitching together Slack messages, a deploy log, and three separate dashboards is where investigations lose the most time.
3. Gather evidence, not opinions. Logs, metrics, traces, recent deploys, config changes, and infrastructure events. The goal is to build a factual record before anyone starts theorizing, because once a plausible story exists, it's hard for a team to keep looking for a better one.
4. Generate and test hypotheses. This is where a technique like the 5 Whys or a fishbone diagram gets applied (see below). Each hypothesis should be checked against the evidence gathered in step 3 — not accepted because it's the first one that sounds right.
5. Identify the root cause — and the contributing factors. Distinguish the actual failure point from the conditions that let it cause damage. "The batch job leaked connections" might be the root cause; "there was no alert on connection pool utilization" is a contributing factor that turned a small bug into a 40-minute outage.
6. Assign corrective action with an owner and a deadline. An RCA that ends with "we should be more careful" produces nothing. An RCA that ends with "add a pool utilization alert at 80%, owned by the platform team, due next sprint" produces something a postmortem review can actually track to closure. (For a deeper breakdown of turning findings into action items that don't die in a backlog, see our guide to postmortem action items.)
7. Verify the fix. Confirm the corrective action actually addresses the root cause — not just that the immediate symptom stopped recurring. A rollback that "fixes" an incident isn't the same as a root cause fix; it just buys time until the underlying condition surfaces again.
This process sits inside the broader response cycle — if you haven't mapped out how RCA fits alongside detection, triage, and communication, our incident response lifecycle guide covers all five phases in detail.
Root Cause Analysis Methods
No single technique works for every incident. The right one depends on how many systems are involved and how tangled the causal chain is.
The 5 Whys
Take a causal statement and ask "why did that happen?" repeatedly — typically five times — until you reach a systemic factor instead of a human decision.
Example: "The database ran out of connections." → Why? "The connection pool was exhausted." → Why? "A batch job wasn't releasing connections properly." → Why? "The batch job had a bug introduced in last week's refactor." → Why wasn't it caught? "The test suite doesn't cover connection cleanup under load." → That's an actionable root cause — not "the engineer who wrote the bug."
The 5 Whys is fast, requires no special tooling, and works well for single-system, linear failures. It breaks down on incidents with multiple interacting causes, because a strictly linear chain of "why" questions can't represent a failure that needed three independent conditions to align. For those cases, use a fishbone diagram instead.
Fishbone (Ishikawa) Diagram
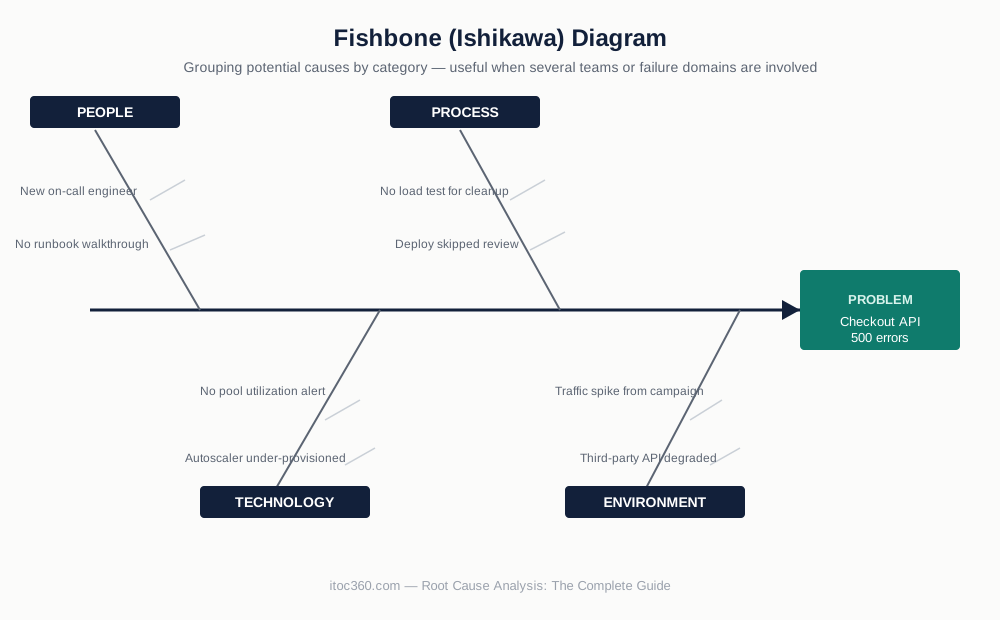
A fishbone diagram organizes potential causes into categories — commonly people, process, technology, and environment for an IT context — branching off a central spine that points at the problem. It's built for group brainstorming: instead of one linear chain, the team explores several categories of causes in parallel, which surfaces contributing factors a strictly sequential method like the 5 Whys tends to miss.
This is the right tool when an incident involved multiple teams or multiple failure domains at once — for example, an outage caused by a combination of a deploy, an under-provisioned autoscaler, and a monitoring gap that delayed detection.
Fault Tree Analysis (FTA)
A top-down, deductive method: start with the failure event at the top and work backward, branching into every condition that could have contributed, down to root-level causes. FTA is heavier to run than the 5 Whys or a fishbone diagram, which makes it a better fit for recurring, high-severity failure modes worth a deeper investment — not for a routine SEV3.
Pareto Analysis
Based on the 80/20 principle: when a system has many small, recurring issues rather than one dramatic failure, Pareto analysis ranks causes by frequency or impact so the team fixes the handful of issues responsible for most of the pain first. This is less useful for a single incident's RCA and more useful at the aggregate level — reviewing a quarter of incidents to find which root cause shows up most often. If your recurrence rate keeps climbing despite individual postmortems looking fine, this is usually the missing layer; our incident management KPIs guide covers how to track that at the aggregate level.
Why Root Cause Analysis Matters
The direct payoff is obvious: fixing the actual cause prevents the incident from recurring, instead of buying a few weeks until the same failure resurfaces in a slightly different form.
The less obvious payoff shows up in your metrics. Teams that treat RCA as a checkbox exercise tend to see MTTR improve short-term (faster mitigation) while recurrence rate stays flat or climbs — because "restart the pod" got faster, but nothing about why the pod needed restarting ever got fixed. A rigorous RCA process is what turns a lower MTTR into a genuinely more reliable system rather than a faster loop of the same failure. It's also the input that makes MTBF — time between failures — trend in the right direction, since MTBF only improves when root causes actually get eliminated rather than just resolved faster.
There's an organizational benefit too: a consistent RCA process gives every team the same vocabulary for "root cause" versus "contributing factor" versus "symptom." Without that shared language, post-incident reviews turn into arguments about whose explanation is right rather than a structured investigation.
Where Manual RCA Breaks Down
The methods above work well on paper and work well in a room with a whiteboard. They get considerably harder in a real distributed system for one structural reason: the evidence needed for step 3 (gather evidence) is scattered across logs, metrics, traces, deploy history, and on-call context — usually in four or five different tools, none of which talk to each other.
In practice, that means the person running the RCA spends most of their time being a human ETL pipeline: pulling a deploy timestamp from one system, cross-referencing it against an error spike in another, and manually correlating both against which services depend on which. That's not a skills problem. It's a tooling gap, and it's the reason RCA quality tends to degrade exactly when it matters most — during a high-severity, multi-service incident where the causal chain crosses team boundaries.
This is where automated correlation changes the shape of the process rather than just speeding it up. Instead of a human manually stitching together logs, metrics, and deploy events after the fact, the platform surfaces the correlation as the incident unfolds — a recent deploy, an anomalous metric, and the affected service's dependency graph presented together, so the team's first hypothesis is grounded in evidence instead of guesswork. It doesn't replace steps 4-6 (a person still has to confirm the hypothesis and decide the fix) — it collapses the time step 3 used to take from the better part of an hour to the first few minutes of the incident. If your team is still assembling that context by hand across four browser tabs during a live SEV1, that's usually the first thing worth automating; see how ITOC360 correlates metrics, logs, and service dependencies during active incidents.
Real-World RCA Examples
Textbook RCA examples tend to come from manufacturing — a conveyor belt failure traced to bearing lubrication, a defect traced to a supplier's material batch. Those are fine illustrations of the method, but they don't map cleanly onto how failures actually unfold in a distributed software system. Three examples that do:
Example 1: The cascading connection pool exhaustion. Symptom: checkout API returns intermittent 500s over 25 minutes. Timeline reconstruction shows a batch job deployed six days earlier started running slightly longer under this week's traffic volume. 5 Whys: batch job ran long → it didn't release DB connections promptly → the connection pool has no ceiling alert → nobody caught the slow leak until it exhausted the pool → the deploy that introduced the leak didn't include a load test for connection cleanup. Root cause: missing test coverage for connection lifecycle under load. Contributing factor: no pool utilization alerting, which let a slow leak go unnoticed for six days instead of being caught the day it shipped.
Example 2: The deploy that broke a dependency nobody tracked. Symptom: a service unrelated to a deploy starts failing 15 minutes after that deploy went out. Fishbone analysis across people/process/technology categories surfaces that the deployed service and the failing service share a rate-limited internal API, and the deploy increased call volume to it. Root cause: an undocumented dependency between two services meant the deploying team had no way to know their change would affect a service they don't own. Corrective action here isn't just a code fix — it's adding the dependency to a service catalog so the next deploy against that API triggers a warning instead of a surprise.
Example 3: The alert that fired correctly and still cost 40 minutes. Symptom: elevated error rate, alert fired within two minutes as designed. Timeline shows the alert went to an on-call engineer who had joined the rotation the week before and didn't recognize which runbook applied. Root cause analysis here doesn't point to a technical failure at all — the system worked exactly as designed. The root cause is a process gap: on-call onboarding didn't include a walkthrough of the runbook index for services outside the new engineer's primary team. This is a case where RCA correctly identifies that the fix isn't code — it's documentation and onboarding.
The common thread across all three: the root cause was rarely the first plausible explanation, and in every case a contributing factor (missing alert, undocumented dependency, onboarding gap) mattered as much as the technical root cause itself.
RCA Is a Process, Not a Meeting
The most common failure mode isn't skipping RCA — it's treating it as something that happens once, in a room, right after the incident, and then never gets revisited. A root cause identified in a postmortem meeting that never turns into a tracked, owned action item is functionally the same as never having found it. If your team's postmortems consistently identify root causes but your recurrence rate isn't improving, the gap usually isn't in the analysis — it's in what happens to the findings afterward. Our guide to running a blameless postmortem meeting covers how to structure the discussion itself; pairing it with a real system for tracking postmortem action items to closure is what turns individual RCAs into a declining incident trend over time.
Frequently asked questions
What are the steps of root cause analysis?
Most RCA frameworks condense to five core steps: define the problem precisely, gather evidence (logs, metrics, timeline), identify possible causes, confirm the actual root cause against the evidence, and implement a corrective action with an owner. The fuller seven-step version used in this guide adds reconstructing the timeline before evidence-gathering and verifying the fix after the corrective action ships.
What are examples of root cause analysis?
In an IT context, a root cause analysis example looks like: an API returns errors (symptom) → investigation traces it to a connection pool exhausted by a batch job that leaked connections (root cause) → the corrective action is fixing the leak and adding a pool-utilization alert so it's caught earlier next time. See the three worked examples above for full walkthroughs, including a cross-service dependency failure and a process-gap incident where the root cause wasn't code at all.
What are the 5 Whys of root cause analysis?
The 5 Whys is a technique, not five fixed questions — it means asking "why did that happen?" repeatedly (typically five times) starting from the symptom, until the answer points to a systemic condition rather than a person's mistake. It works best on single-system, linear failures and struggles on incidents with multiple interacting causes.
Is root cause analysis the same as a postmortem?
No. RCA is the specific activity of tracing why an incident happened; a postmortem is the full document that includes RCA alongside the incident timeline, impact, what went well, and tracked action items. RCA is one section of a postmortem, not a substitute for it.
How is root cause analysis different in IT versus manufacturing?
The core method is identical — trace backward from symptom to underlying cause. What differs is the evidence: manufacturing RCA relies on physical inspection and process data, while IT/SRE RCA relies on logs, metrics, traces, and deploy history, usually scattered across several tools that need to be correlated manually or with automated tooling.
Related Guides
RCA doesn't happen in isolation — it's one step inside a larger incident response and learning cycle. These guides cover the rest of that cycle:
Incident Response Lifecycle — where RCA fits among the five phases of responding to an incident, from detection to resolution.
ITIL 5 Problem Management — where RCA sits in the ITIL problem process, from problem control to known errors and error control.
Blameless Postmortem Meeting Guide — how to structure the meeting where RCA findings get discussed and turned into a shared document.
Postmortem Action Items — how to track the corrective actions an RCA produces so they don't die in a backlog.
Incident Management vs. Problem Management — why RCA belongs to problem management, not incident response, and why conflating the two is a common process mistake.
Incident Management KPIs — how to tell, at the aggregate level, whether your RCA process is actually reducing recurrence or just producing paperwork.
MTTR: Mean Time to Resolve and MTTR, MTTA, MTBF, MTTD Explained — the metrics a rigorous RCA process should move over time, and how to calculate them.
If your team is still assembling incident context by hand across logs, metrics, and deploy history, see how ITOC360 correlates that evidence automatically during an active incident.