Alert Correlation: How It Works, 5 Methods Compared, and How to Avoid Bad Groupings
A database runs out of connections at 3 a.m. Within two minutes, your monitoring fires 40 alerts: slow queries, API timeouts, failed health checks, a spike in 5xx errors, and a queue backing up. Every one of them is real. Only one of them is the problem.
Alert correlation is how you turn those 40 alerts into one incident with one page, pointing at the database. It's the step that decides whether your on-call engineer starts diagnosing the root cause or spends the first 15 minutes figuring out which alerts belong together.
Quick answer: Alert correlation is the process of grouping different alerts that share a common cause into a single incident. It works by comparing alerts on time, shared attributes (like host, service, or cluster), known dependencies between services, recent changes, or learned patterns. Unlike deduplication, which merges repeats of the same alert, correlation links alerts that look different but come from the same failure. Done well, it cuts pages per incident sharply. Done badly, it groups unrelated problems together and hides a second outage.
This guide compares the five main correlation methods, shows how to pick a time window, walks through a real outage from first alert to single incident, and explains how to catch bad groupings before they cost you. We build ITOC360, an incident orchestration platform that correlates alerts from Zabbix, Prometheus, Datadog, Grafana, and other monitoring tools, so the patterns here reflect what we see in real alert streams.
Key facts at a glance
What it does | Groups different alerts with a common cause into one incident |
Also called | Event correlation, incident correlation, alert grouping (loosely) |
Main methods | Time-based, attribute-based, topology-based, change-based, machine learning |
Runs after | Deduplication, which removes repeats of the same alert first |
Biggest risk | Grouping unrelated alerts, which hides a second incident |
Metrics to watch | Alerts per incident, pages per incident, false merge rate, split rate |
Where it sits | Between monitoring tools and on-call routing |
What Is Alert Correlation?
Alert correlation is the practice of recognizing that several alerts, often from different tools and different services, are symptoms of the same underlying problem, and presenting them to responders as one incident.
Modern systems fail in cascades. When one component breaks, everything that depends on it starts complaining too. Monitoring tools can't tell the difference between a cause and a symptom. They just report what they see. Correlation adds the missing context.
Here's what that looks like for the database outage above:
Time | Alert | Source | Correlated? |
|---|---|---|---|
03:00:12 | Connection pool exhausted on | Zabbix | Yes, likely cause |
03:00:40 | p95 query latency above 2s on | Prometheus | Yes, same resource |
03:01:05 |
| Datadog | Yes, depends on |
03:01:18 |
| Prometheus | Yes, depends on |
03:01:30 | Synthetic checkout test failing | Grafana | Yes, symptom of |
03:02:10 | Disk usage above 80% on | Zabbix | No, unrelated host and cause |
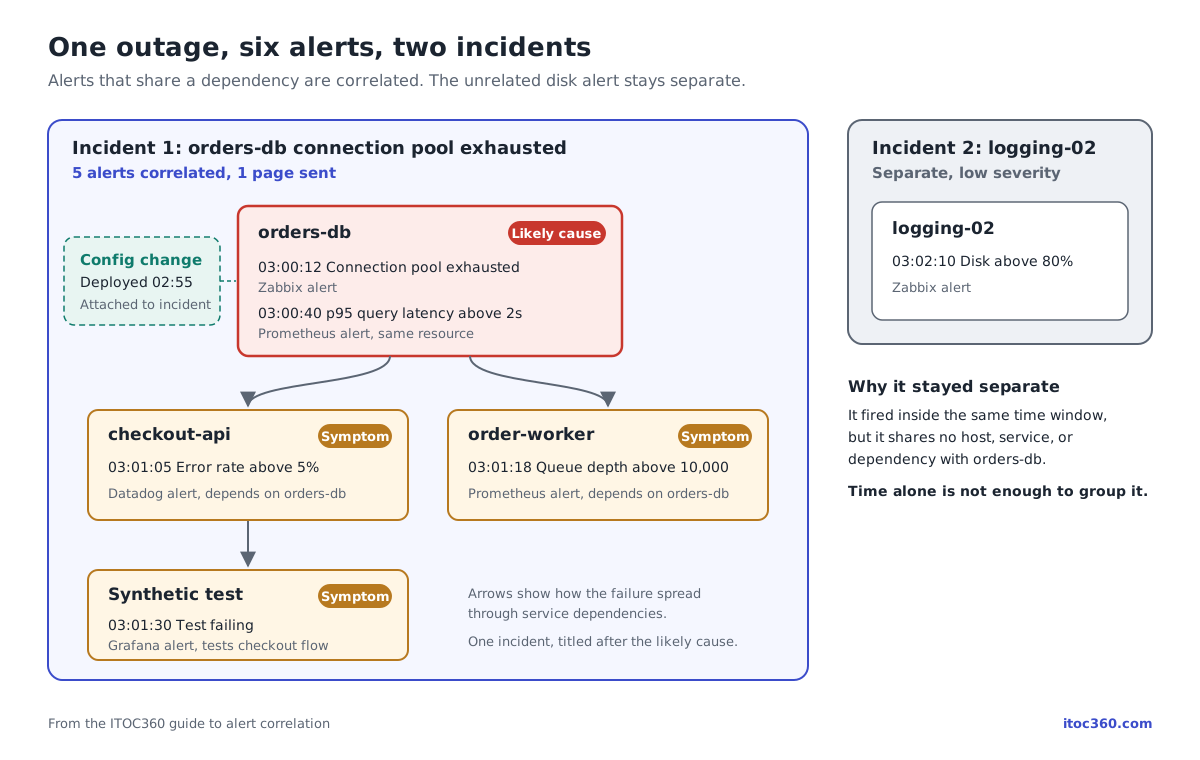
Five alerts become one incident, titled around the database. The disk alert on the logging server stays separate, because it has nothing to do with the outage. That last row matters as much as the first five. A correlation engine that grouped it in would be hiding a second problem.
Alert Correlation vs Deduplication vs Event Correlation vs Root Cause Analysis
These terms overlap in vendor marketing, but they describe different jobs.
Term | What it does | Example |
|---|---|---|
Deduplication | Merges repeats of the same alert | 30 "disk full" events from one host become one alert |
Alert correlation | Groups different alerts with a common cause | Database, API, and queue alerts become one incident |
Event correlation | The broader term, covering raw events, logs, and alerts | Often used in AIOps and ITOM products for the same idea |
Root cause analysis (RCA) | Explains why the failure happened | The connection pool was sized for last year's traffic |
Two points are worth spelling out.
Deduplication comes first. Correlating before you deduplicate means the engine wastes effort on echoes. Our alert deduplication guide covers that step in detail, including how to design keys.
Correlation points toward the cause, but it isn't RCA. A good engine can suggest the likely root alert, usually the earliest one or the one furthest upstream in the dependency chain. Explaining why that component failed is still a human job, and it belongs in the post-incident review. See our root cause analysis guide for that part.
You'll also see "alert correlation" used in security, where SIEM tools correlate intrusion alerts to reconstruct multi-step attacks. The ideas are similar, but this guide focuses on IT operations: outages, degradations, and infrastructure failures.
Why Alert Correlation Matters
Without correlation, every symptom of an outage is a separate page, and one upstream failure turns into an alert storm. Google's SRE guidance treats on-call load as something to cap, with only a couple of real incidents per shift (SRE Workbook). A single storm can blow through that in minutes. It creates three problems at once.
Too many people get woken up. The database team, the API team, and the queue owners all get paged for one failure, and each starts investigating in parallel.
Responders chase symptoms. The first alert someone opens is rarely the cause. Minutes go by before anyone realizes the API errors are downstream of the database.
Real alerts get ignored. When most pages turn out to be noise, people stop trusting them.
The numbers back this up. In Splunk's State of Observability 2025 survey of 1,855 ITOps and engineering professionals, 73% said they had experienced outages due to ignored or suppressed alerts. In our own analysis of 1 million alerts, 60 to 80 percent of the alerts fired in a month needed no meaningful human action: they were duplicates, symptoms of a single upstream cause, or problems that resolved on their own.
Correlation targets the middle group, the symptoms. Across 14 engineering teams on ITOC360 in Q2 2026, correlating alerts before paging cut pages per incident from 8.4 to 1.2 (source).
It's also why correlation sits at the heart of AIOps. Gartner, which coined the term, describes AIOps as combining big data and machine learning to automate IT operations processes, with event correlation first on its list (Cisco). For the wider picture, see what AIOps is and how it works.
5 Alert Correlation Methods Compared
Every correlation engine uses some mix of five methods. Each answers a different question about whether two alerts belong together.
Method | Question it asks | What you need | Strength | Weakness |
|---|---|---|---|---|
Time-based | Did these alerts fire close together? | Nothing beyond timestamps | Works on day one | Groups coincidences during busy periods |
Attribute-based | Do they share a host, service, cluster, or tag? | Consistent labels across tools | Precise and easy to explain | Misses cascades across different services |
Topology-based | Is one service upstream of the other? | An accurate dependency map or CMDB | Finds cause vs. symptom | Breaks when the map is stale |
Change-based | Did a deploy or config change just happen here? | Deployment and change events | Often the fastest explanation | Needs CI/CD and change data flowing in |
Machine learning | Have alerts like these appeared together before? | History of past alerts and incidents | Catches patterns nobody wrote a rule for | Harder to explain; needs review |
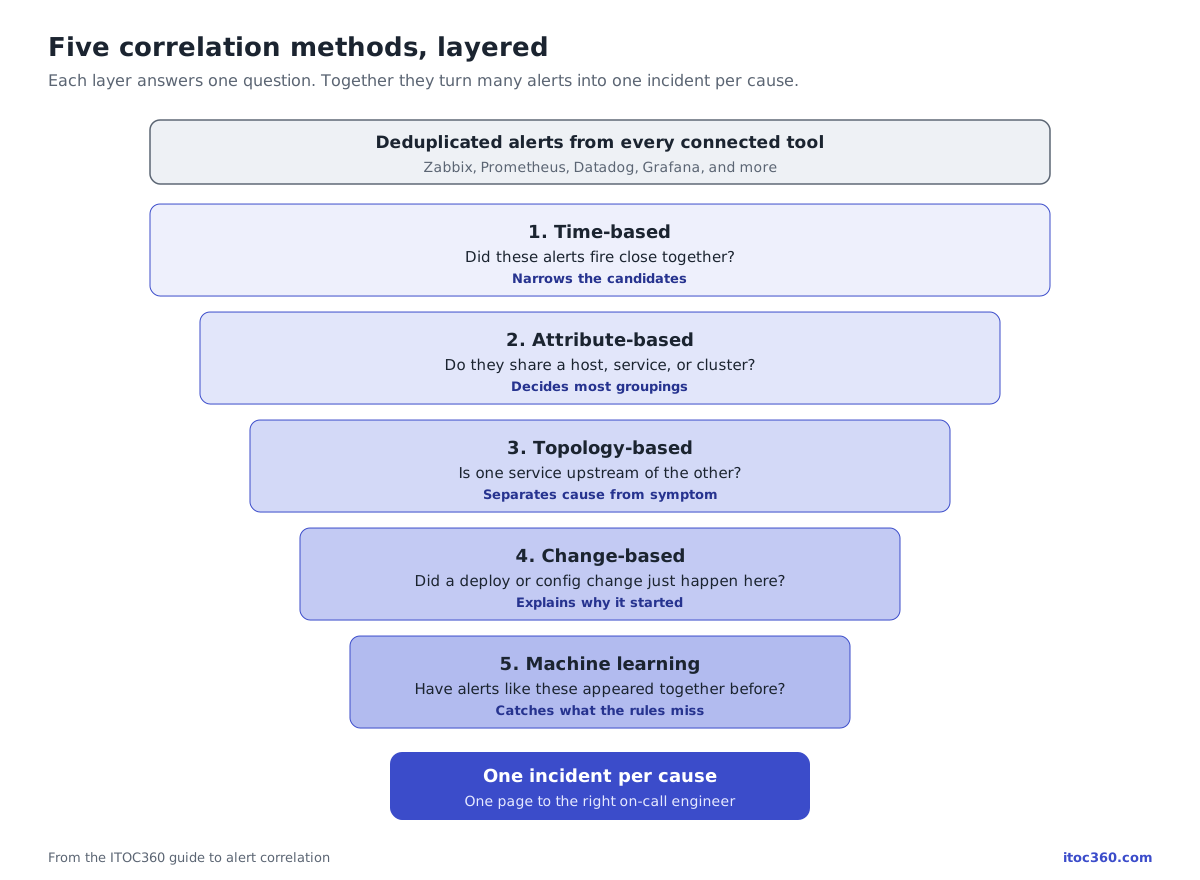
Time-based correlation
The simplest method: alerts that fire within the same window, say five minutes, are candidates for grouping. On its own it's too blunt, because a busy system always has something firing. It works best as a first filter that the other methods then refine.
Attribute-based correlation
Alerts that share a key attribute, such as the same host, service, cluster, or environment, are grouped. This is where clean labels pay off. If Zabbix calls a server DB-PROD-02 and Datadog calls it db-prod-02.us-east.internal, attribute matching fails. Normalize names first, the same way you would for deduplication. Our alert routing guide covers normalization as the first stage of the alert pipeline.
Topology-based correlation
The engine uses a map of which services depend on which. If checkout-api depends on orders-db, and both are alerting, the database is marked as the likely cause and the API as a symptom. This is the method that best separates cause from effect, and the one that fails most quietly when the dependency map is out of date.
Change-based correlation
Many incidents start with a change. Linking alerts to a recent deploy, feature flag, or config update on the same service often explains the incident in one line. It depends on having change events from your CI/CD pipeline or change management process in the same place as your alerts.
Machine learning correlation
ML models learn which alerts tend to appear together, based on past incidents, and group new alerts that follow the same pattern. They're good at catching relationships no one thought to write a rule for. The trade-off is transparency. Responders need to see why two alerts were grouped, or they won't trust the result.
That's why the setup that holds up in production is hybrid: rules for known failure modes, ML for the patterns rules miss, and human review before any new grouping logic applies automatically. We explain the reasoning in why pure rules and pure ML both hit a ceiling.
In practice, strong setups layer these methods: time narrows the candidates, attributes and topology decide most groupings, change data explains many of them, and ML catches what the rules miss. ITOC360 starts from the same idea: it compares labels, resources, and timestamps across every connected monitoring tool, and uses machine learning to find the groupings a fixed rule would miss.
How an Alert Correlation Engine Works
Whatever the method, a correlation engine makes the same four decisions for every incoming alert.
Is there an open incident this alert could belong to? The engine looks at incidents opened within the correlation window, usually a few minutes.
Does it match? It checks the alert against those incidents using the methods above: shared attributes, dependencies, recent changes, or learned patterns.
Is it a cause or a symptom? If it matches, the alert joins the incident. If it sits upstream of the current root alert, it may become the new root, and the incident title changes to match.
If nothing matches, open a new incident and page the owner.
Two more capabilities separate good engines from basic ones:
Merge and split. Responders can combine two incidents the engine kept apart, or pull an alert out of one it wrongly grouped. Each correction is a signal the engine should learn from.
Explanations. Every grouping should show its reason: "same host," "
checkout-apidepends onorders-db," or "deployed 4 minutes before the first alert." Without that, responders second-guess every incident.
The correlation step belongs between deduplication and alert routing and it's the third stage of the alert management lifecycle. Correlate too late, after paging, and people are already awake. Correlate too early, before deduplication, and the engine drowns in repeats.
How to Choose a Correlation Time Window
The time window is the most important setting in any correlation setup, and the one most teams leave at the default.
Too short, and a slow cascade gets split into several incidents. The queue backs up eight minutes after the database fails, and with a five-minute window it pages someone new.
Too long, and unrelated alerts that happen to fire during the same hour get merged into one incident.
The practical approach is to base the window on how fast failures actually spread in your systems:
Pull your last 20 real incidents. For each, measure the time between the first alert and the last related one.
Take the typical spread time. If most cascades finish within 10 minutes, that's your baseline.
Set the window to roughly twice that. If outages usually spread within 10 minutes, keep the window at no more than 20. Going longer mostly adds coincidental alerts, not related ones.
Use different windows for different systems. A network outage spreads in seconds. A slow memory leak can take an hour to affect downstream services.
Stop adding alerts once the incident resolves. A new alert after resolution should start a new incident, not reopen an old one silently.
Revisit the window every quarter. As your architecture changes, so does how fast failures travel through it.
Worked Example: One Outage, Start to Finish
Here's how the layered methods handle the database outage from the start of this guide.
03:00:12. Zabbix reports connection pool exhaustion on orders-db. No open incident matches, so the engine opens one, marks this alert as the root, and pages the database on-call.
03:00:40. Prometheus reports high query latency on orders-db. Same resource, within the window. Attribute match. It joins the incident. No new page.
03:01:05. Datadog reports checkout-api errors. Different tool, different service. But the dependency map shows checkout-api calls orders-db. Topology match. It joins as a symptom. No new page.
03:01:18. Prometheus reports a growing order-worker queue. Also downstream of the database. Topology match. Joins the incident.
03:01:30. A synthetic checkout test fails in Grafana. It tests checkout-api, which is already a symptom. Joins the incident.
03:02:10. Zabbix reports high disk usage on logging-02. It fires inside the window, but shares no attributes or dependencies with orders-db. No match. The engine opens a separate, low-severity incident for the logging team. Time alone wasn't enough to group it, which is exactly right.
03:04:00. The engine finds a config change to orders-db deployed at 02:55. Change match. The change is attached to the incident, and the responder sees it before opening a single dashboard.
The result: one page instead of five for the outage, a clear title pointing at the database, a likely trigger already attached, and a second, unrelated problem that didn't get lost. The team can then follow its escalation policy and runbook from a single incident. This is the outcome ITOC360 is built around: one incident and one page, no matter how many tools saw the outage.
When Alert Correlation Goes Wrong
Correlation fails in two directions. Under-grouping leaves you with too many incidents, which is annoying but visible. Over-grouping merges unrelated problems, which is worse, because it fails silently. As we noted in our 1 million alerts analysis, grouping two unrelated alerts during a real incident makes the response harder, not easier.
These are the failure modes we see most often:
Attributes that are too broad. Grouping on
env=prodorregion=us-east-1pulls half your estate into one incident. Correlate on attributes that actually identify a failure domain: service, host, cluster, or database.A stale dependency map. A service was moved to a new database last month, but the map still points at the old one. Now its alerts get attached to the wrong incident. Topology correlation is only as good as the map behind it.
Every deploy looks guilty. Teams that ship dozens of times a day will always have a recent change nearby. Link changes only on the same service and within a short window, and treat them as suggestions, not conclusions.
Severity gets buried. A critical alert joins an incident that was opened as low severity, and nobody notices the escalation. The incident's severity should rise to match its worst alert, and that change should notify the owner.
Black-box groupings. When an ML model groups alerts without showing why, responders stop trusting it and start checking every alert by hand, which undoes the point.
Windows that never close. An incident that stays open for days keeps absorbing unrelated alerts. Close the window when the incident resolves.
One question catches most of these early. Add it to every post-incident review: "Was any alert grouped into this incident that didn't belong, or kept out that should have been in?"
How to Measure Alert Correlation Quality
A high compression number on a dashboard doesn't prove correlation is working. You need to measure both how much it groups and how often it groups correctly.
Metric | How to calculate it | What good looks like |
|---|---|---|
Alerts per incident | Alerts received ÷ incidents created | Rising at first, then stable |
Pages per incident | Notifications sent ÷ incidents | Close to 1 for most incidents |
Single-alert incident rate | Incidents with only one alert ÷ all incidents | Falling; a high rate means little is being correlated |
False merge rate | Incidents a responder had to split ÷ incidents | Low and falling. This is your safety metric |
Missed merge rate | Incidents a responder had to merge ÷ incidents | Low; a high rate means the window or attributes are too narrow |
Root alert accuracy | Incidents where the suggested root matched the RCA ÷ reviewed incidents | Rising over time |
Watch the false merge rate most closely. Compression that hides a second outage isn't a win. Pair these with MTTA and MTTR: if correlation is doing its job, responders acknowledge faster because they're paged once, and resolve faster because they start at the cause. For the full metric set, see our incident management KPIs.
How ITOC360 Correlates Alerts
ITOC360 sits between your monitoring tools and your on-call team, so correlation happens once, for every source, before anyone is paged.
Correlation at ingest. ITOC360 groups related alerts by label, resource, and timestamp proximity using machine learning models, so an alert storm lands as a single actionable incident rather than dozens of pages.
Different tools, same outage, one incident. Alerts from Zabbix, Prometheus, Datadog, Grafana, New Relic, Amazon CloudWatch, and other integrations are correlated together, so a database alert from one tool and an API alert from another end up in the same place.
Deduplication first. Repeats of the same alert are merged before correlation runs, as described in our deduplication guide.
One page to the right person. The incident goes to whoever is on call for the affected service, by voice call, SMS, push, Slack, or Microsoft Teams, and escalates automatically if nobody acknowledges.
ITOC360 teams see about 70% less alert noise. Across 14 engineering teams in Q2 2026, correlating alerts before paging cut pages per incident from 8.4 to 1.2. Or, as one reviewer put it: "Alert deduplication and correlation work as advertised."
Getting Started: A 30-Day Rollout Plan
You don't need a perfect dependency map to start. Most teams get real results by adding methods one at a time and checking each against past incidents.
Week 1: Clean the inputs
Turn on deduplication and confirm repeats of the same alert merge correctly.
Normalize host, service, and environment names across every monitoring tool.
Pull your last 20 incidents and note which alerts belonged together.
Week 2: Start simple
Enable time-based plus attribute-based correlation on service and host.
Set the window to roughly twice your typical cascade time.
Replay last month's alerts and compare the groupings with what actually happened.
Week 3: Add context
Map dependencies for your 10 most critical services, even if only in a simple list.
Send deploy and change events into the same platform as your alerts.
Make sure every grouping shows its reason to the responder.
Week 4: Measure and tune
Track false merges and missed merges weekly.
Add the grouping question to every post-incident review.
Compare pages per incident and MTTA with your starting baseline.
Only bring in ML-based correlation once the basics are working. A model trained on messy, unnormalized alerts learns messy groupings.
If you use ITOC360, most of weeks 1 and 2 comes down to connecting your monitoring tools. Normalization and correlation run at ingest across every source, so your time goes into reviewing groupings rather than building the pipeline.
Frequently asked questions
What is alert correlation?
Alert correlation groups different alerts that share a common cause into a single incident, so responders see one problem instead of dozens of separate notifications.
What is the difference between alert correlation and deduplication?
Deduplication merges repeats of the same alert. Correlation links different alerts, often from different tools and services, that come from the same underlying failure.
Is alert correlation the same as event correlation?
Mostly. Event correlation is the broader term and can include raw events and logs. In IT operations, the two are often used interchangeably.
What are the main types of alert correlation?
The five main methods are time-based, attribute-based, topology-based, change-based, and machine learning correlation. Most effective setups combine several of them.
What are the main types of alert correlation?
The five main methods are time-based, attribute-based, topology-based, change-based, and machine learning correlation. Most effective setups combine several of them.
What is topology-based correlation?
Topology-based correlation uses a map of service dependencies to decide which alert is the likely cause and which are downstream symptoms.
What is topology-based correlation?
Topology-based correlation uses a map of service dependencies to decide which alert is the likely cause and which are downstream symptoms.
How long should a correlation time window be?
A common rule is about twice the time failures typically take to spread through your systems. If most cascades finish within 10 minutes, a window of up to 20 minutes is a reasonable start.
Can alert correlation hide real incidents?
Yes. If it groups unrelated alerts, a second problem can be buried inside the first incident. Track the false merge rate and review groupings after every major incident.
Does alert correlation find the root cause?
It can suggest the likely root alert, usually the earliest or most upstream one. Explaining why the failure happened still requires root cause analysis.
How is AI used in alert correlation?
Machine learning models learn which alerts tend to appear together in past incidents and group new alerts that follow the same pattern. They work best alongside rule-based and topology-based methods, and when each grouping shows its reason.
How does ITOC360 correlate alerts?
ITOC360 groups related alerts by label, resource, and timestamp proximity using machine learning models. It works across every connected monitoring tool, so alerts from Zabbix, Prometheus, Datadog, and Grafana about the same outage become one incident with one page to the on-call engineer.
Final Thoughts
Alert correlation is what turns a flood of symptoms into one problem someone can actually fix. Start with clean inputs and simple methods, base your window on how failures really spread, and add topology, change data, and machine learning as your confidence grows. Above all, measure how often groupings are wrong, not just how many alerts they absorb.
If you'd like to see correlation across Zabbix, Prometheus, Datadog, and the rest of your stack in one place, try ITOC360 free.
Related Reading
Alert Deduplication: How It Works, How to Design Dedup Keys, and Mistakes to Avoid
We Processed 1 Million Alerts. Here's What We Learned About Noise
What Is IT Alerting? A Practical Guide for Engineering Teams
IT Monitoring in 2026: What It Is, What to Monitor, and How to Make Alerts Count
NOC Monitoring: What It Is, How It Works, and Why It Matters
Root Cause Analysis (RCA): The Complete Guide for IT & SRE Teams
Sources
Splunk, State of Observability 2025
Cisco, What is AIOps? (includes Gartner's definition)
IEEE Xplore, Understanding and Handling Alert Storm for Online Service Systems
arXiv, Contrastive Learning for Correlating Network Incidents
ITOC360, We processed 1 million alerts: what we learned about noise
ITOC360, ITIL 5 incident management (Q2 2026 team data)