Alert Management: The Complete Guide for IT Operations and SRE Teams
Most teams don't have an alerting problem. They have an alert management problem. The monitoring works, the alerts fire, and the notifications go out. What breaks is everything in between: repeats nobody merged, symptoms nobody connected, pages that went to the wrong person, and rules nobody has reviewed since they were written.
Alert management is the discipline that covers that whole path, from the moment a monitoring tool fires to the moment someone confirms the problem is fixed and the rule that caught it is still worth keeping.
Quick answer: Alert management is the end-to-end process of receiving, filtering, grouping, prioritizing, routing, escalating, and resolving alerts from monitoring systems, then reviewing the rules that produced them. Its goal is simple: every page a human receives should be real, owned, and actionable. The core stages are ingestion, deduplication, correlation, prioritization, routing, escalation, resolution, and review.
This guide walks through each stage, the states an alert moves through, how to tell a good alert from a noisy one, a four-level maturity model, and the metrics that show whether your alert management is improving. Each stage links to a deeper guide in our alert management series. We build ITOC360, an incident orchestration platform used by IT operations, NOC, and SRE teams, so the examples reflect what we see in real alert streams.
Key facts at a glance
What it is | The process of turning raw monitoring alerts into owned, actionable work |
Main stages | Ingest, deduplicate, correlate, prioritize, route, escalate, resolve, review |
Who owns it | IT operations, NOC, SRE, and DevOps teams |
Sits between | Monitoring tools and incident response |
Core rule | Every page should be real, owned, and actionable |
Biggest obstacle | Alert fatigue, cited by 30% of 1,363 respondents in Grafana Labs' 2026 survey |
Metrics to watch | Actionable alert rate, pages per incident, MTTA, repeat alert rate |
What Is Alert Management?
Alert management is how an organization handles the alerts its monitoring systems produce. It decides which alerts reach a person, which are merged or grouped, who owns each one, how fast it must be acknowledged, what happens if nobody responds, and how the rules themselves get better over time.
A useful way to think about it: monitoring asks "is something wrong?" Alert management asks "does a human need to know, which human, and how soon?"
Good alert management has three outcomes:
Fewer pages. Repeats and symptoms are merged before anyone is woken up.
Clear ownership. Every alert that does reach a person reaches the right one, with escalation if they don't respond.
Continuous cleanup. Rules that page without needing action are tuned or removed.
The term is also used in security operations, where SOC teams manage alerts from SIEM and intrusion detection tools. The principles overlap, but this guide focuses on IT operations: outages, degradations, and infrastructure alerts.
Who uses alert management?
Any team that is paged when production breaks: SRE and DevOps teams running cloud services, platform teams responsible for shared infrastructure, IT operations teams running servers, networks, and business applications, and 24/7 NOC teams watching many customers or sites at once. Managed service providers (MSPs) have the hardest version of the problem, because they handle alerts from dozens of client environments with different owners and SLAs.
Alert Management vs Monitoring vs Alerting vs Incident Management
These four terms describe one chain. Each hands off to the next.
Term | What it does | Ends when |
|---|---|---|
Monitoring | Collects metrics, logs, and checks, and detects abnormal conditions | A condition crosses a threshold and an alert fires |
Alerting | Delivers a notification to a person or channel | Someone receives it |
Alert management | Decides which alerts matter, merges and groups them, assigns an owner, escalates, and tunes the rules | The alert is resolved and the rule is reviewed |
Incident management | Coordinates the response to a real service disruption | Service is restored and the post-incident review is done |
Alerting is one part of alert management, the delivery step. Alert management is the layer that decides what gets delivered in the first place. And incident management begins where alert management hands off a confirmed, owned problem.
For the pieces on either side, see IT monitoring in 2026, what IT alerting is, and incident management vs problem management.
Events, alerts, and incidents
Three more words that often get mixed up:
An event is anything a system records: a login, a deploy, a CPU reading, a failed request. Most events are normal.
An alert is created when one or more events meet a rule that says a person may need to know.
An incident is a real disruption to a service that needs a coordinated response.
Thousands of events produce a handful of alerts, and a handful of alerts should produce one incident. Alert management is what keeps those ratios healthy.
The Alert Management Lifecycle: 8 Stages
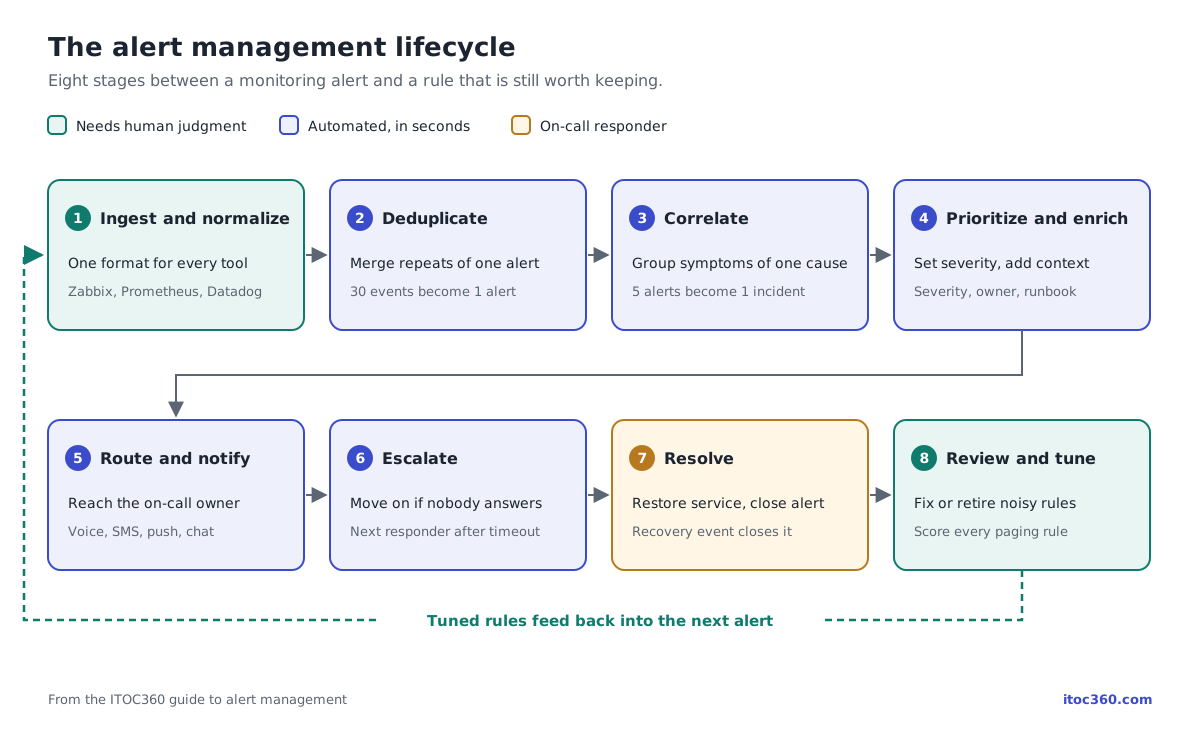
Every alert, whatever tool it comes from, should pass through the same eight stages. Skipping one is usually where the trouble starts.
1. Ingest and normalize
Alerts arrive from every monitoring source: Zabbix, Prometheus, Datadog, Grafana, cloud providers, and custom scripts. Each uses its own format, field names, and severity scale. Normalizing them into one shape, with consistent host names, services, environments, and severities, is what makes every later stage work. Our alert routing guide covers this first stage in detail.
2. Deduplicate
A check that runs every minute reports the same problem every minute. Deduplication merges those repeats into one open alert with a counter, so one full disk doesn't produce 30 pages. The key design decisions are covered in our alert deduplication guide.
3. Correlate
One failure causes many different alerts: the database, the API that depends on it, the queue behind the API. Correlation groups those symptoms into one incident that points at the likely cause. See alert correlation: 5 methods compared.
4. Prioritize and enrich
Not every alert deserves a phone call at 3 a.m. Each alert or incident gets a severity based on business impact, not just the metric that fired. A shared severity matrix keeps everyone using the same definitions.
This is also where alerts get context: the owning service and team, recent deploys, links to dashboards and runbooks. And it's where planned work is filtered out, so alerts from systems in a maintenance window are silenced instead of paging anyone.
5. Route and notify
The incident goes to the person on call for the affected service, through a channel that will actually wake them: voice call or SMS for critical issues, chat or email for lower severities. Routing by service ownership, not by tool, is what stops alerts landing in a shared inbox nobody watches. Our on-call best practices cover how to design the rotations behind it.
6. Escalate
If nobody acknowledges within a set time, the incident moves to the next person or team automatically. Without escalation, a missed page is a missed incident. Our escalation policy guide shows how to set the tiers and timeouts.
7. Resolve
The responder restores service, and the alert closes, ideally automatically when the monitoring tool sends a recovery event. Tracking MTTA and MTTR here shows how fast the whole chain works.
8. Review and tune
This is the stage most teams skip. After incidents, and on a regular schedule, review which rules paged without needing action and fix or remove them. Scoring each rule by how often it leads to real work, as we describe in our 1 million alerts analysis, turns cleanup from guesswork into a routine.
Stages 2 through 6 should happen automatically, in seconds. Stages 1 and 8 are where human judgment matters most.
Alert States: What Happens to an Alert After It Fires
An alert isn't just "on" or "off." Clear states make it obvious who is doing what, and they're what most alert management metrics are built on.
State | Meaning | Who acts next |
|---|---|---|
Triggered | The alert fired and is waiting for someone to take it | The on-call responder |
Acknowledged | A person owns it and is working on it; escalation stops | The same responder |
Snoozed or silenced | Paused on purpose, for example during planned maintenance | Nobody until the timer ends |
Resolved | The condition cleared, manually or by a recovery event | Nobody, unless it comes back |
Closed | Reviewed and archived, with any follow-up recorded | The team, at the next review |
Two rules keep these states honest. Acknowledging an alert should mean "I'm on it," not "make the noise stop," so an acknowledged alert that sits untouched for hours needs its own reminder. And silences should always have an end time. A permanent silence is just a deleted alert that nobody admits to deleting.
What Makes a Good Alert?
A good alert is one a human needs to act on, now. Google's SRE team puts it plainly: every page should be actionable, and every page should require intelligence rather than a robotic response (Google SRE book).
Before adding or keeping any rule that pages a person, check it against five questions:
Is it urgent? If it can wait until morning, it should be a ticket, not a page.
Is it actionable? The responder must be able to do something about it. If the only response is "wait and see," it isn't a page.
Does it describe user impact? "Checkout errors above 5%" beats "CPU above 80%." Symptoms users feel are better pages than causes they don't.
Does it have an owner? Every paging rule should map to one service and one on-call rotation.
Does it link to a runbook? The first five minutes of response should never start with a search. See runbook vs playbook.
If a rule fails two or more of these, downgrade it to a ticket or dashboard, or delete it. Most teams find that a large share of their paging rules don't pass.
What every alert should include
A responder opening an alert should be able to start work without searching for anything. Every paging alert should carry:
Field | Example |
|---|---|
A specific title | "Checkout API error rate above 5% in us-east" rather than "High errors" |
Affected service and environment |
|
Severity | SEV2 |
Owner | Payments team, current on-call |
What triggered it | The metric, the threshold, and the current value |
Where to look | Links to the dashboard and the runbook |
What changed recently | The last deploy or config change on that service |
Why Alert Management Breaks Down
Alert fatigue is still the most common complaint in operations, and the data has been consistent for years.
In Grafana Labs' 2026 Observability Survey of 1,363 practitioners, alert fatigue was the top obstacle to faster incident response, cited by 30% of respondents, nearly double the next answer.
In Splunk's State of Observability 2025, 73% of 1,855 ITOps and engineering professionals said they had experienced outages due to ignored or suppressed alerts.
In our own analysis of 1 million alerts, 60 to 80 percent of monthly alert volume needed no meaningful human action.
Put those together and the pattern is clear: teams receive far more alerts than they can act on, start tuning them out, and eventually miss one that mattered.
It rarely comes down to one bad setting. It's usually a gap in one of the lifecycle stages:
Gap | What it looks like | Stage to fix |
|---|---|---|
No deduplication | One disk sends 30 pages | |
No correlation | One database outage pages five teams | |
No ownership | Alerts land in a shared channel and sit | |
No escalation | A missed page becomes a missed incident | |
No review | Rules written years ago still page every night | Review and tune |
For a deeper look at the causes and types of noise, see what alert noise is and how to eliminate it.
The Alert Management Maturity Model
Most teams sit somewhere on this four-level scale. Knowing your level tells you what to fix next, instead of trying to fix everything at once.
Level | What it looks like | Typical signs | Next step |
|---|---|---|---|
1. Reactive | Alerts go to email or a team chat channel | No named owners; incidents found by customers; nobody knows who is on call | Set up on-call rotations and route critical alerts to a person, not a channel |
2. Managed | Alerts page an on-call engineer, with escalation | Severity levels defined; repeats deduplicated; still many pages per outage | Correlate alerts across tools and normalize names |
3. Correlated | One incident per cause, across every monitoring tool | Pages per incident near 1; metrics tracked monthly; some rules still noisy | Start a regular rule review and score every paging rule |
4. Continuously improving | Rules are reviewed, scored, and retired on a schedule | Noisy rules fixed within weeks; alerts tied to user impact and SLOs; AI suggestions reviewed by humans | Keep the review loop running as the system changes |
Moving up one level at a time is realistic. Most teams can go from level 1 to level 2 in a few weeks, because it's mostly about ownership and routing. Level 3 depends on clean data, and level 4 depends on habit more than tooling.
The Role of AI in Alert Management
AI is most useful in the parts of alert management that involve patterns across large volumes: grouping related alerts, spotting which rules are noisy, summarizing what happened in a busy incident, and suggesting a likely cause from past incidents. Grafana Labs found that practitioners are open to AI in operations, but want it to be explainable and to earn its place (Grafana Labs, 2026).
A practical split looks like this:
Let AI do it | Let AI suggest, a human decides | Keep human-led |
|---|---|---|
Group related alerts into one incident | Severity and likely root cause | Remediation in production |
Flag noisy or stale rules | Which rules to retire or retune | Changes to paging policy |
Summarize the incident timeline | Draft post-incident reviews | Customer communication |
The common thread is transparency. When AI groups two alerts, the responder should see why. We explain why a hybrid of rules and machine learning holds up better than either alone in our 1 million alerts analysis, and cover the methods in our alert correlation guide.
Alert Management Metrics That Matter
Track these monthly, split by severity and by team. Together they show whether alerts are getting fewer, better, and faster to handle.
Metric | How to calculate it | What it tells you |
|---|---|---|
Actionable alert rate | Pages that led to real action ÷ all pages | The single best measure of alert quality |
Pages per incident | Notifications sent ÷ incidents | Whether deduplication and correlation are working |
Pages per on-call shift | Pages ÷ shifts, per person | Whether on-call load is sustainable |
MTTA (mean time to acknowledge) | Average time from page to acknowledgment | Whether people trust and respond to pages |
MTTR (mean time to resolve) | Average time from alert to resolution | How fast the whole chain works |
Escalation rate | Incidents that escalated past the first responder ÷ incidents | Whether routing and schedules are right |
Repeat alert rate | Alerts with the same cause within 30 days ÷ alerts | Whether the review stage is fixing root causes |
If you track only one, track the actionable alert rate. It's the metric that falls first when noise creeps in, and it's the one that improves first when you clean up. For more on the time-based metrics, see our MTTR, MTTA, MTBF, and MTTD glossary.
How to Choose Alert Management Software
Monitoring tools can send notifications, but they weren't built to manage alerts across a whole stack. When you evaluate an alert management platform, test it against your own alerts, not a demo, and check these capabilities:
Integrations with your actual stack. Native connections to the monitoring, cloud, and chat tools you already use, including both problem and recovery events.
Deduplication and correlation across tools. Not just merging repeats from one source, but grouping related alerts from different tools into one incident, with a visible reason for each grouping.
On-call schedules and escalation. Rotations, overrides, time zones, and multi-step escalation built in, not bolted on.
Notification channels that wake people up. Voice calls and SMS for critical alerts, with push, chat, and email for the rest.
Maintenance windows and silences with required end times.
Reporting. The metrics above, out of the box, per team and per rule.
Migration support. If you're moving off a tool that's being retired, such as Opsgenie, check how schedules, escalation policies, and integrations carry over. Our Opsgenie end-of-life guide covers the timeline.
Run a two-week trial with one noisy team. Compare pages per incident and MTTA before and after. That tells you more than any feature list.
How ITOC360 Handles Alert Management
ITOC360 covers stages 1 through 7 of the lifecycle in one platform, and gives you the data for stage 8.
One intake for every tool. Alerts from Zabbix, Prometheus, Datadog, Grafana, Splunk, New Relic, Amazon CloudWatch, and custom workflows arrive in one place. ITOC360 is listed in the Zabbix integration directory, on the Prometheus integrations page, and as a verified n8n node.
Deduplication and correlation at ingest. Repeats merge into one alert, and related alerts are grouped by label, resource, and timestamp using machine learning, so an alert storm becomes one actionable incident.
On-call and escalation built in. ITOC360 reads your live schedule, pages the engineer who can act by voice call, SMS, push, Slack, Microsoft Teams, or email, and escalates until someone answers.
Maintenance and silencing. Planned work doesn't page anyone.
Migration from Opsgenie. Schedules, escalation policies, and alert sources can be mapped from your Opsgenie export.
ITOC360 teams see about 70% less alert noise. Across 14 engineering teams in Q2 2026, correlating alerts before paging cut pages per incident from 8.4 to 1.2.
Frequently asked questions
What is alert management?
Alert management is the process of receiving, filtering, grouping, prioritizing, routing, escalating, and resolving alerts from monitoring systems, and then reviewing the rules that produced them, so that every page a person receives is real, owned, and actionable.
What are the stages of alert management?
The eight stages are ingest and normalize, deduplicate, correlate, prioritize and enrich, route and notify, escalate, resolve, and review and tune.
What is the difference between alerting and alert management?
Alerting is the delivery of a notification. Alert management is the wider process that decides which alerts are worth delivering, to whom, how urgently, and what happens if nobody responds.
What is the difference between alert management and incident management?
Alert management handles the signals that something may be wrong. Incident management coordinates the response once a real service disruption is confirmed.
What is alert management software?
Alert management software collects alerts from monitoring tools, deduplicates and correlates them, routes them to the right on-call engineer, escalates when nobody responds, and reports on alert quality.
How do you reduce alert fatigue?
Deduplicate repeats, correlate related alerts into one incident, page only for urgent and actionable problems, route by service ownership, and review noisy rules on a regular schedule.
What makes an alert actionable?
An actionable alert is urgent, has a clear owner, describes user impact, links to a runbook, and requires a human decision rather than a routine response.
What metrics measure alert management?
The most useful are actionable alert rate, pages per incident, pages per on-call shift, MTTA, MTTR, escalation rate, and repeat alert rate.
How does ITOC360 manage alerts?
ITOC360 ingests alerts from every connected monitoring tool, deduplicates and correlates them into single incidents using machine learning, and pages the on-call engineer by voice, SMS, push, or chat, escalating until someone responds.
How often should alert rules be reviewed?
Review noisy rules after every major incident, and review all paging rules at least once a quarter. Rules that rarely lead to real action should be retuned, downgraded to tickets, or deleted.
What is the difference between reactive and proactive alert management?
Reactive alert management responds after something breaks and a threshold is crossed. Proactive alert management alerts on early signs of user impact, such as error budgets burning faster than expected, and keeps rules tuned before they cause noise.
Do small teams need alert management?
Yes. Small teams often feel noise the most, because the same few people are on call every week. Basic deduplication, clear ownership, and escalation make a big difference even with a handful of services.
Final Thoughts
Good alert management isn't about sending fewer alerts for the sake of it. It's about making sure the alerts that do reach a person are worth their attention, reach the right person, and never get lost. Get ownership and routing right first, then deduplicate and correlate, and keep reviewing the rules. The teams with the quietest on-call rotations aren't the ones with the least monitoring. They're the ones with the best alert management.
If you'd like to see all eight stages working across your own monitoring tools, try ITOC360 free.
The Alert Management Series
Alert Deduplication: How It Works, How to Design Dedup Keys, and Mistakes to Avoid
Alert Correlation: How It Works, 5 Methods Compared, and How to Avoid Bad Groupings
We Processed 1 Million Alerts. Here's What We Learned About Noise
What Is IT Alerting? A Practical Guide for Engineering Teams
IT Monitoring in 2026: What It Is, What to Monitor, and How to Make Alerts Count
NOC Monitoring: What It Is, How It Works, and Why It Matters
Sources
Grafana Labs, Observability Survey 2026
Splunk, State of Observability 2025
Google, Site Reliability Engineering: Monitoring Distributed Systems
Zabbix, ITOC360 integration
Prometheus, Integrations
ITOC360, We processed 1 million alerts: what we learned about noise