Canary Deployment: What It Is, How It Works & Examples

Quick answer: A canary deployment is a release strategy that sends a small share of real traffic, often 1% to 5%, to a new version of a service while everyone else stays on the current version. The team compares the canary's error rate, latency and business metrics with the current version. If they look healthy, traffic moves to the new version in steps until it serves everyone; if not, the canary is rolled back, and only a small group of users was ever affected.
The name comes from coal mining. Miners once took canaries underground because the birds reacted to toxic gas before people did; a struggling canary was an early warning to get out. In software, the small group of users on the new version plays the same role: if something is wrong, they show it first, while everyone else is still safe.
Canary deployments are one of the safest ways to release changes to a production system, because the real test of a release is real traffic, and a canary limits how many people take part in that test. They're also one of the easiest strategies to get wrong. A canary that runs for two minutes, on too little traffic, with nobody comparing the numbers, only gives the appearance of safety.
This guide explains how a canary deployment works, walks through a step-by-step example, covers canary analysis in depth, shows how to run canaries on Kubernetes, AWS and Google Cloud, compares canary with blue-green and rolling deployments, and lists the mistakes that make canaries fail.
What is a canary deployment?
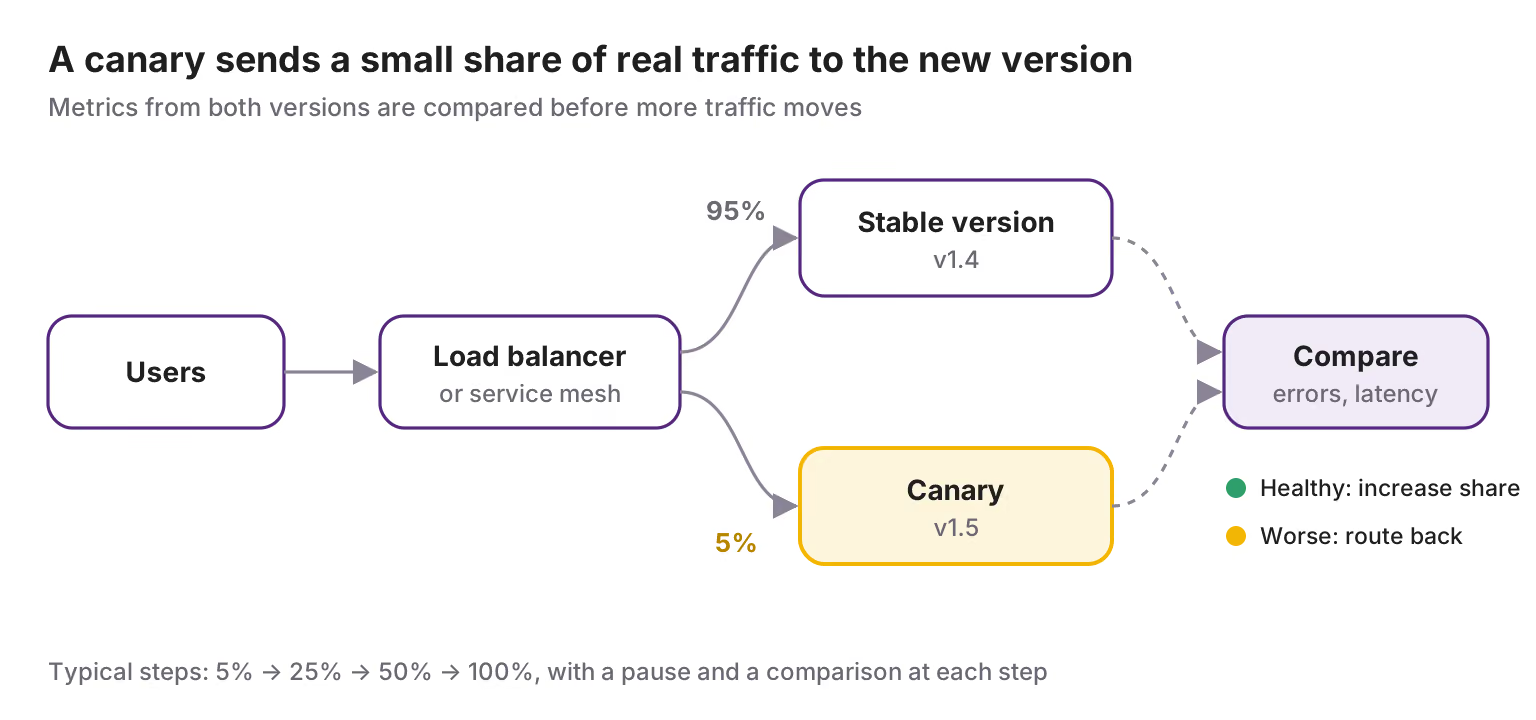
A canary deployment, also called a canary release, is a way of releasing a new version of software to a small subset of users before rolling it out to everyone. Both versions run in production at the same time. A router, load balancer or service mesh decides which requests go to the new version, and the team watches how that version behaves before sending it more traffic.
How does a canary deployment work?
Deploy the new version alongside the old one. The canary runs on a few instances; the stable version keeps serving almost all traffic.
Send a small share of traffic to the canary. Typically 1% to 5%, chosen at random or by a rule, such as internal users first.
Compare the canary with the stable version. Look at error rate, latency, resource use and key business metrics over a set period.
Decide: promote, hold or roll back. If the canary is as healthy as the stable version, increase its share. If it's worse, send its traffic back to the stable version.
Repeat until the canary serves everyone. Each step increases the share, for example 5% → 25% → 50% → 100%, with a pause and a comparison at each one.
Retire the old version. Once the new version serves all traffic and stays healthy, remove the old instances.
The key idea is in step 3. A canary deployment isn't just a slow rollout; it's an experiment, and the comparison between the two versions is what makes it safe.
Canary deployment example: a step plan with gates
Here's what a canary release plan might look like for an e-commerce checkout API that handles a few thousand requests a minute.
Step | Traffic to canary | Minimum time | Move on if | If not |
|---|---|---|---|---|
1 | 1%, internal users only | 15 minutes | No new errors in logs; synthetic checkout passes | Roll back |
2 | 5% of all users | 30 minutes | Error rate no more than 20% above stable; p95 latency within 10% of stable | Roll back |
3 | 25% | 30 minutes | Same as step 2, plus checkout conversion no more than 2% below stable | Roll back |
4 | 50% | 30 minutes | Same as step 3; CPU and memory per request close to stable | Roll back |
5 | 100% | Watch for 24 hours | Metrics stay at the stable baseline | Roll back or fix forward |
A few details make this plan work:
The gates are relative. The canary is compared with the stable version running at the same time, not with a fixed number. If both versions show 1% errors because of a downstream problem, that's not the canary's fault.
Each step has a minimum time. Some problems, such as memory leaks or slow cache warm-ups, only show after a while.
A business metric is included. A release can be technically healthy and still break the purchase flow.
Rollback is the default. If a gate fails, the canary goes back without discussion. The team decides afterwards whether to try again.
The whole rollout takes about two hours here. Smaller, low-risk changes can move faster; changes to payments, authentication or data storage deserve slower steps.
Benefits and drawbacks of canary deployments
Benefits:
Small blast radius. A bad release affects only the canary share, often a few percent of users, instead of everyone.
Tested with real traffic. No staging environment fully reproduces production data, load and user behaviour; a canary is tested by all three.
Fast rollback. Rolling back means routing traffic back to the stable version, which is already running.
Little extra infrastructure. Unlike blue-green, you only need capacity for the canary share, not a full second environment.
Evidence, not hope. Each step produces data that shows whether the new version is at least as good as the old one.
Drawbacks:
Needs good monitoring. Without metrics you can compare by version, a canary is just a slow rollout.
Needs traffic routing. Splitting traffic by percentage requires a load balancer, service mesh or progressive delivery tool that supports it.
Two versions at once. Both versions must work with the same databases, caches and APIs throughout the rollout.
Hard for low-traffic services. At a few requests a minute, a 5% canary may not see enough traffic to tell good from bad.
Slower releases. A careful canary takes minutes to hours, which some teams find frustrating for small changes.
Canary analysis: how to decide if a canary is healthy
Canary analysis is the step where you compare the canary with the stable version and decide whether to continue. It's the part that turns a slow rollout into a safe one, and the part most teams under-invest in.
Compare with a baseline, not a fixed threshold
A fixed rule like "error rate under 1%" misses problems that the stable version doesn't have, and blames the canary for problems it didn't cause. Compare the two versions running at the same time, under the same traffic. Some teams go further and start a fresh baseline, a few new instances of the old version, at the same moment as the canary, so both have equally cold caches and equally new processes. This is the approach behind automated canary analysis tools such as Kayenta, developed by Netflix and Google.
What to measure
Signal | What to compare | Example gate |
|---|---|---|
Errors | 5xx rate, failed requests, exceptions in logs | Canary error rate no more than 20% above baseline |
Latency | p50, p95 and p99 response time | p95 within 10% of baseline |
Saturation | CPU, memory and connections per request | No steady climb over the step |
Business metrics | Checkouts, sign-ups, searches per user | No drop beyond normal variation |
New failure types | Log messages or error codes that the baseline never shows | Any new critical error fails the canary |
Synthetic checks | Key journeys run against the canary | All pass |
The first three are part of the four golden signals. Synthetic checks are especially useful at the first step, when real canary traffic is still small.
How long to wait at each step
Long enough for the canary to see enough requests to tell a real difference from noise, and long enough for slow problems to appear. In practice:
Count requests, not minutes. A few thousand requests per step is a reasonable minimum for comparing error rates.
Cover the behaviour that matters. If the service runs hourly jobs or has peak periods, make sure the canary sees them before reaching 100%.
Watch for slow failures. Memory leaks and connection-pool exhaustion often take 20 to 60 minutes to show.
What if the service has little traffic?
A 5% canary on a service with ten requests a minute won't tell you much. Options:
Use a larger first step, such as 25%, with longer pauses.
Add synthetic traffic against the canary for the key journeys.
Use feature flags to release to a known group, such as internal users, first.
Choose blue-green instead, testing fully on the idle environment before switching.
Automate the decision
A person watching dashboards during every rollout doesn't scale and misses slow trends. Tools such as Argo Rollouts, Flagger and Spinnaker with Kayenta query your metrics at each step and promote or roll back automatically. People stay in charge of the rules, not of every decision.
Canary deployment in Kubernetes
Kubernetes Deployments don't have a built-in canary strategy; they support rolling updates and recreate. There are three common ways to run a canary on Kubernetes, from simplest to most capable.
1. Two Deployments behind one Service
The approach shown in the official Kubernetes tutorial: run the stable and canary versions as two Deployments that share a label the Service selects on.
# Stable: 9 replicas
apiVersion: apps/v1
kind: Deployment
metadata:
  name: checkout-stable
spec:
  replicas: 9
  selector:
    matchLabels: {app: checkout, track: stable}
  template:
    metadata:
      labels: {app: checkout, track: stable}
    spec:
      containers:
      - name: checkout
        image: registry.example.com/checkout:1.4
---
# Canary: 1 replica, about 10% of traffic
apiVersion: apps/v1
kind: Deployment
metadata:
  name: checkout-canary
spec:
  replicas: 1
  selector:
    matchLabels: {app: checkout, track: canary}
  template:
    metadata:
      labels: {app: checkout, track: canary}
    spec:
      containers:
      - name: checkout
        image: registry.example.com/checkout:1.5
The Service selects only app: checkout, so it sends traffic to both. It's simple, but the split depends on replica counts, it's only approximate, and nothing analyses the result for you.
2. Argo Rollouts
Argo Rollouts replaces the Deployment with a Rollout resource that understands canary steps and can run automated analysis between them.
apiVersion: argoproj.io/v1alpha1
kind: Rollout
metadata:
  name: checkout
spec:
  replicas: 10
  strategy:
    canary:
      steps:
      - setWeight: 5
      - pause: {duration: 15m}
      - analysis:
          templates:
          - templateName: success-rate
      - setWeight: 25
      - pause: {duration: 30m}
      - setWeight: 50
      - pause: {duration: 30m}
  # selector and pod template as in a normal Deployment
The analysis template queries your metrics and fails the rollout if the success rate drops:
apiVersion: argoproj.io/v1alpha1
kind: AnalysisTemplate
metadata:
  name: success-rate
spec:
  metrics:
  - name: success-rate
    interval: 1m
    failureLimit: 2
    successCondition: result[0] >= 0.99
    provider:
      prometheus:
        address: http://prometheus.monitoring:9090
        query: |
          sum(rate(http_requests_total{app="checkout",status!~"5.."}[2m]))
          /
          sum(rate(http_requests_total{app="checkout"}[2m]))
With a service mesh or ingress controller configured, Argo Rollouts can split traffic by exact percentage instead of by replica count.
3. Flagger
Flagger works alongside a normal Deployment. You describe the canary policy, and Flagger shifts traffic through a service mesh or ingress controller and checks metrics at each step.
apiVersion: flagger.app/v1beta1
kind: Canary
metadata:
  name: checkout
spec:
  targetRef:
    apiVersion: apps/v1
    kind: Deployment
    name: checkout
  service:
    port: 80
  analysis:
    interval: 1m
    threshold: 5       # failed checks before rollback
    stepWeight: 10     # increase traffic by 10% per step
    maxWeight: 50      # then promote
    metrics:
    - name: request-success-rate
      thresholdRange: {min: 99}
      interval: 1m
    - name: request-duration
      thresholdRange: {max: 500}
      interval: 1m
Which to choose?
Approach | Exact traffic split | Automated analysis | Extra components |
|---|---|---|---|
Two Deployments | No, by replica ratio | No | None |
Argo Rollouts | Yes, with a mesh or ingress | Yes | Argo Rollouts controller |
Flagger | Yes | Yes | Flagger plus a mesh or ingress |
Teams already using Argo CD for GitOps often choose Argo Rollouts; teams with Istio, Linkerd or a supported ingress controller often choose Flagger. The Kubernetes Gateway API can also split traffic by weight between two Services, which both tools can use.
Canary deployments on AWS, Google Cloud and Azure
The major clouds have canary support built into several services, so you don't always need extra tooling:
Platform | Service | How canary works |
|---|---|---|
AWS | Lambda with CodeDeploy | Shifts a share of traffic to a new function version through a weighted alias, using predefined patterns such as 10% for 5 minutes, then 100% |
ECS with CodeDeploy | Moves traffic between task sets behind a load balancer, with canary or linear traffic-shifting configurations | |
API Gateway | Canary release settings send a percentage of API traffic to a canary stage | |
Application Load Balancer | Weighted target groups split traffic between two versions | |
Google Cloud | Cloud Deploy | A canary strategy with percentage phases for GKE and Cloud Run targets |
Cloud Run | Traffic splitting between revisions by percentage | |
Azure | App Service | Deployment slots with a percentage of traffic routed to the staging slot |
On AWS, CloudWatch alarms can be attached to a CodeDeploy deployment so that it rolls back automatically if an alarm fires during the canary. Whatever the platform, the same rule applies: the traffic split is the easy part, and the alarms or analysis that decide when to stop are what make it safe.
Canary vs blue-green vs rolling deployment
What's the difference between canary and blue-green deployment? Blue-green runs two full environments and switches all users from one to the other at once; canary runs both versions together and moves users over gradually. Both roll back quickly. The real difference is when you find a problem: blue-green finds it on everyone, briefly; canary finds it on a few, first.
A useful way to see the three side by side is to ask what moves the rollout forward:
Canary | Blue-green | Rolling | |
|---|---|---|---|
What moves the rollout forward | Metrics comparison at each step | A single switch, after testing the idle environment | New instances passing health checks |
Users on the new version at first | A few percent | All, at the moment of the switch | A growing share as instances are replaced |
Can stop halfway? | Yes, at any step | No; it's all or nothing | Yes, but the mix is by instance, not by user |
Detects | Problems only real traffic reveals | Problems a pre-switch test reveals | Crashes and failed health checks |
Best when | You have steady traffic and good metrics | You need instant, all-at-once rollback and can test fully first | You need a simple, built-in default |
Can you combine them? Yes, and many teams do. A common pattern is to deploy the new version to a green environment, then shift traffic to it in canary steps instead of all at once. Another is to run a rolling update for the code with the new feature behind a flag, released canary-style to a growing group of users.
For how all seven common strategies compare, including shadow and A/B testing, see our comparison of deployment strategies.
Canary deployment tools
Canary tooling falls into five groups. Most teams combine one from the first three with their existing monitoring and feature flag tools.
Category | What it does | Examples |
|---|---|---|
Progressive delivery controllers for Kubernetes | Run canary steps and automated analysis inside the cluster | Argo Rollouts, Flagger |
Continuous delivery platforms | Orchestrate canaries across environments, often with built-in analysis | Spinnaker with Kayenta, Harness, Octopus Deploy, GitLab |
Cloud-native deployment services | Canary traffic shifting for a cloud provider's own services | AWS CodeDeploy, Google Cloud Deploy, Azure App Service |
Traffic routing | Split traffic by percentage, header or cookie | Istio, Linkerd, NGINX Ingress canary annotations, Traefik, Kubernetes Gateway API |
Feature flag platforms | Release features canary-style to chosen users, independent of deployment | LaunchDarkly, Flagsmith, Unleash |
What to look for in a canary deployment tool:
Exact traffic control: percentage-based splitting, not only by replica count.
Automated analysis: queries to your existing metrics, with automatic promote and rollback.
Baseline comparison: comparing the canary with the current version, not just fixed thresholds.
Visibility: a clear view of which step a rollout is at, and why it stopped.
Alerting: a way to notify the right people when a canary fails or pauses.
Common canary deployment mistakes
Mistake | Why it's a problem | Fix |
|---|---|---|
No comparison, just waiting | A slow rollout with nobody comparing metrics catches nothing a normal rollout wouldn't | Compare canary and baseline at every step, automatically |
Steps that are too short | Slow problems such as memory leaks appear after the canary has reached 100% | Set a minimum time and a minimum number of requests per step |
Fixed thresholds only | Blames the canary for problems the stable version also has, or misses ones it doesn't | Use thresholds relative to the baseline |
Ignoring business metrics | A technically healthy release can still break checkout or sign-up | Add one or two business metrics to the analysis |
Sticky sessions not handled | A user bounces between versions mid-session and sees inconsistent behaviour | Keep each user on one version for the duration of the canary |
Shared data not considered | The canary writes data the old version can't read | Make changes backward compatible, using the expand-and-contract pattern for schemas |
Silent rollbacks | The tool rolls back, nobody is told, and the same release is tried again tomorrow | Alert the owning team on every failed or paused canary |
When not to use a canary deployment
Canaries aren't always the right choice:
Very low traffic. If the canary can't see enough requests to compare, use blue-green with thorough testing, or feature flags to a known group.
Changes that can't run alongside the old version, such as some database or protocol changes. Use a staged migration first, or a strategy that switches all at once.
Urgent security fixes. When the old version is the risk, roll out quickly and watch closely instead of holding most users on it.
Batch jobs and offline processing. There's no live traffic to split; test against a sample of real data instead.
Where ITOC360 fits
A canary that fails safely is only half the job. Someone still has to find out why, and decide whether the next release is safe. ITOC360 makes sure that happens:
Failed and paused canaries reach a person. Alerts from Argo CD, Prometheus, Grafana, Datadog and other tools are routed to the on-call owner of the service through ITOC360 On-Call, with automatic escalation if nobody acknowledges.
One rollout, one incident. Canary analysis alerts, backend errors and synthetic check failures from the same release are grouped into a single incident instead of a stream of separate pages.
A record for the review. The incident timeline shows when the canary started, when it failed and when it rolled back, which is the starting point for the follow-up.
Your canary tool limits how many users a bad release reaches; ITOC360 makes sure the right engineer knows about it within minutes.
Frequently asked questions
What is a canary deployment?
A canary deployment releases a new version of software to a small share of users first, often 1% to 5%, while everyone else stays on the current version. The team compares the two versions and increases the canary's share step by step only if it's healthy.
Why is it called a canary deployment?
The name comes from the canaries coal miners carried underground as an early warning of toxic gas. The small group of users on the new version plays the same role: they reveal problems before everyone is affected.
What is the difference between canary and blue-green deployment?
Blue-green switches all users from the old environment to the new one at once; canary moves a small share of users first and increases it gradually. Both roll back quickly, but a canary limits how many users a problem reaches.
What percentage of traffic should a canary get?
A first step of 1% to 5% is common for high-traffic services, followed by steps such as 25%, 50% and 100%. Low-traffic services often need a larger first step, such as 10% to 25%, to see enough requests to compare.
How long should a canary deployment run?
Long enough at each step to see a few thousand requests and any slow problems, such as memory leaks. Many teams pause 15 to 60 minutes per step, and keep watching for a day after reaching 100%.
What is canary analysis?
Canary analysis compares the canary's metrics, such as error rate, latency and resource use, with the current version's to decide whether to continue, pause or roll back. It's often automated with tools such as Argo Rollouts, Flagger or Kayenta.
Does Kubernetes support canary deployments?
Not as a built-in Deployment strategy. You can run two Deployments behind one Service for a basic canary, or use Argo Rollouts or Flagger for exact traffic splitting and automated analysis.
What is the difference between a canary deployment and a canary release?
They're usually used to mean the same thing. Where a distinction is made, a canary deployment refers to putting the new code on a small set of servers, and a canary release to exposing a new feature to a small set of users, often with feature flags.
What are the best canary deployment tools?
On Kubernetes, Argo Rollouts and Flagger are the most widely used. Spinnaker with Kayenta, Harness and Octopus Deploy offer canaries across environments, and AWS CodeDeploy and Google Cloud Deploy support canaries for their own services.