Synthetic Monitoring: What It Is, Types, Examples & Alerting (2026)

Quick answer: Synthetic monitoring is a way of testing a website, app or API by running scripted checks against it on a schedule, from different locations, as if a user were using it. A check might load the home page, log in, add an item to the cart or call an API, and then confirm the response is correct and fast enough. Because the checks run all the time, even when no real users are active, synthetic monitoring often finds problems before customers do. It's also called active monitoring, and it complements real user monitoring (RUM), which measures what actual visitors experience.
Most monitoring waits for something to happen. Logs, metrics and real user monitoring all describe traffic that already exists. If nobody is using your checkout at 4 a.m., none of them will tell you it's broken until the first customer arrives.
Synthetic monitoring doesn't wait. It acts like a robot user that visits your site or calls your API every minute or so, from several places in the world, and checks that each step works. When a step fails, you know right away, whether there's real traffic or not.
This guide explains how synthetic monitoring works, the main types, how it compares with real user and passive monitoring, real examples, how to set up checks, and the part most guides skip: how to alert on synthetic failures without flooding your on-call team with false alarms.
How does synthetic monitoring work?
Every synthetic monitoring tool follows the same basic loop:
Pick what to test. Usually a page, an API endpoint or a user journey, such as "log in and open the dashboard".
Write the check. A simple check requests a URL. A scripted check follows several steps, the way a person would: open the page, type a username, click a button.
Add assertions. Rules that define success, for example "the response code is 200", "the page contains 'Order confirmed'" or "the whole journey takes less than 3 seconds".
Choose where and how often. The tool runs the check from probe locations in different regions, typically every 1 to 5 minutes.
Run and record. Each run records whether every step passed, how long each step took and, for browser checks, often a screenshot or video of the failure.
Alert on failure. If assertions fail, usually after a confirmation run, the tool sends an alert to your on-call or incident tool.
There are two main techniques:
Technique | What it does | Good for |
|---|---|---|
Protocol checks | Send requests directly, such as HTTP, DNS, TCP or ICMP, and check the response | Uptime, APIs, certificates, network paths; cheap to run every minute |
Browser checks | Drive a real headless browser through a scripted journey | Login, search, checkout and anything that depends on JavaScript or third-party scripts |
Most teams use both: protocol checks for broad, frequent coverage, and a few browser checks for the journeys that make money.
Types of synthetic monitoring
Type | What it checks | Example | Typical frequency |
|---|---|---|---|
Uptime (availability) checks | Is the site or endpoint reachable and returning the right status code? |
| Every 30–60 seconds |
API monitoring | Does an API respond correctly, with the right data, fast enough? Multi-step API checks chain calls together | Create a test order, read it back, delete it | Every 1–5 minutes |
Browser and transaction monitoring | Can a user complete a full journey in a real browser? | Log in, search for a product, add it to the cart, reach the payment page | Every 5–15 minutes |
SSL and DNS checks | Is the certificate valid and not about to expire? Does the domain resolve to the right address? | Alert 21 days before a certificate expires | Every few hours |
Network checks | Is the path to the service healthy: latency, packet loss, routing? | Ping and traceroute from five regions to the API gateway | Every 1–5 minutes |
Mobile app checks | Do key flows work in a real or emulated mobile app? | Open the app and load the account screen | Every 15–60 minutes |
Synthetic transaction monitoring is the name usually given to browser or multi-step API checks that follow a full business transaction, such as signing up or paying. These are the most valuable checks, because they test what actually earns money, and the most fragile, because any change to the page can break the script.
For domain-level checks, see also our guide to domain and DNS monitoring.
Synthetic monitoring vs real user monitoring (RUM) vs passive monitoring
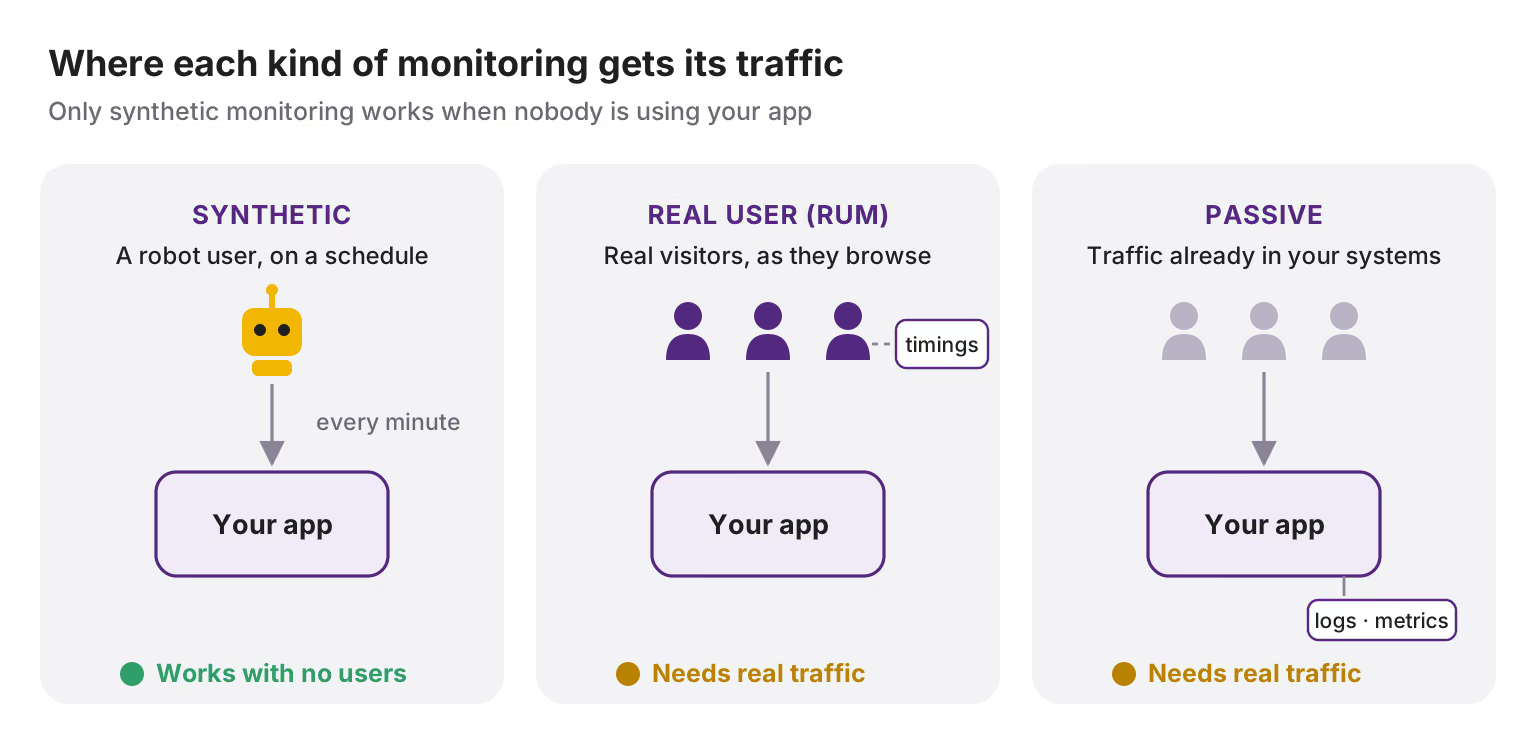
These three approaches answer different questions. Most teams need at least two of them.
Synthetic monitoring | Real user monitoring (RUM) | Passive monitoring | |
|---|---|---|---|
Also called | Active monitoring | End-user monitoring | Traffic or log-based monitoring |
How it works | Runs scripted checks on a schedule | A script in the page or app reports what real visitors experience | Watches existing traffic, logs and metrics on your servers and network |
Needs real traffic? | No | Yes | Yes |
Best at | Catching outages early, testing from many regions, checking before launches | Showing real-world speed and errors across devices, browsers and networks | Seeing everything that actually happens inside your systems |
Blind spots | Only tests the paths you script | Can't see problems when nobody is visiting; noisy across varied devices | Only sees traffic that reaches your systems |
Typical question it answers | "Is checkout working right now?" | "How slow is checkout for mobile users in Brazil?" | "Which service is returning errors?" |
Synthetic vs RUM in one line: synthetic monitoring tells you something is broken; RUM tells you how many real users it affected and how.
Synthetic vs passive monitoring: passive monitoring observes the traffic you already have, so it's comprehensive but reactive. Synthetic monitoring creates its own traffic, so it's proactive but limited to what you script. Passive monitoring is the backbone of observability; synthetic checks fill the gaps when traffic is low or a dependency outside your systems fails.
Why use synthetic monitoring? Benefits and limits
Benefits:
Find problems before customers do. A failing check pages someone before the first support ticket arrives, which directly lowers your mean time to detect.
Works without traffic. Overnight, on weekends and on new features nobody uses yet.
Tests from where your users are. Checks from several regions show whether a problem is global or limited to one location or provider.
Measures third parties. Payment providers, login services and CDNs can fail outside your systems; a synthetic journey that uses them will notice.
Gives clean, comparable numbers. The same check, from the same place, every minute, makes trends and regressions easy to see.
Protects releases. Run checks against staging before a deploy and against production right after it.
Provides evidence for SLAs. An independent record of availability and response time from outside your infrastructure.
Limits:
It only tests what you script. A broken page nobody wrote a check for stays invisible.
Scripts break. A changed button label can fail a browser check even though users are fine. These false alarms are the main reason teams stop trusting synthetic monitoring.
It's not real experience. Probes run on fast, clean networks; your users don't. Pair it with RUM for the real picture.
It costs money at scale. Browser checks are far more expensive to run than simple HTTP checks, which limits how many you can afford to run every minute.
Synthetic monitoring use cases and examples
Use case | Example check | What it catches |
|---|---|---|
E-commerce checkout | Browser journey: search, add to cart, reach the payment page with a test card, every 5 minutes from 3 regions | A broken cart, a failing payment provider, a slow product page |
SaaS login | Browser journey: log in with a test account and load the dashboard | Broken single sign-on, expired certificates on the identity provider |
Public API | Multi-step API check: authenticate, create a record, read it back, delete it | Auth failures, slow responses, wrong data |
Global services | The same uptime check from 6 regions | Regional outages, DNS or CDN problems in one country |
After every deploy | Run the critical journeys right after a release | Changes that pass tests but break production |
Third-party dependencies | API check against a payment or email provider's sandbox | Upstream outages before your own users report them |
Certificates and domains | Daily SSL and DNS checks | Expiring certificates, hijacked or broken DNS records |
Start with the journeys that make money. For most products that's three to five checks: the home page, login, the core action users pay for, and the main API. Add more only when an incident shows a gap.
How to set up synthetic monitoring
List your critical journeys. Ask which failures would cost money or trust within minutes. Those get checks first.
Use dedicated test accounts and data. Never run synthetic checks with real customer accounts. Mark test orders so they're excluded from reports and never shipped.
Write assertions that match user impact. Check for the text or element a user needs to see, not just a 200 status code. A page can return 200 and still show an error.
Set realistic time limits. Base them on normal performance plus a margin, for example the 95th percentile of the last month plus 50%.
Pick locations that match your users. At least two or three regions, so one probe's network problem doesn't look like an outage.
Choose a frequency per check. Every minute for uptime and key APIs; every 5 to 15 minutes for browser journeys, which cost more to run.
Make scripts resilient. Select page elements by stable identifiers rather than visible text or layout, so routine design changes don't break checks.
Connect alerts to on-call. Decide who gets paged for each check before it ever fails. The next section covers how.
Review checks every quarter. Remove ones that never fire, fix ones that fire falsely, and add checks for gaps found in incidents.
What to measure: availability of each check, total response time, time per step for transactions, and error type. These map neatly onto the four golden signals: availability and errors, latency, and, indirectly, saturation when response times climb under load.
How to alert on synthetic checks without false alarms
Synthetic monitoring is only useful if people trust its alerts. One flaky browser script that pages someone at 3 a.m. three nights in a row, and the team starts muting it. These rules keep alerts meaningful.
1. Confirm before you page. Re-run a failed check immediately, ideally from a different location. Page only if it fails again. Most synthetic tools support a retry or confirmation setting.
2. Require more than one location. A rule such as "fails from at least 2 of 3 regions" filters out problems with a single probe's network. A failure from one region only is still worth a ticket, but rarely a page.
3. Route by what failed, not by which tool fired. A failed checkout journey belongs to the payments team's on-call rotation, not to whoever set up the monitoring tool.
4. Match urgency to the journey.
Check | Failure | Response |
|---|---|---|
Checkout or login journey | Confirmed from 2+ regions | Page immediately (SEV1 or SEV2) |
Public API | Confirmed from 2+ regions | Page the API owner |
Any check | Fails from one region only | Ticket, no page; watch for spread |
Response time | Above the limit but still working | Ticket, or page only if sustained for 15+ minutes |
SSL certificate | Expires in under 21 days | Ticket to the owning team |
Script error (element not found, test data missing) | The check is broken, not the service | Ticket to whoever maintains the check |
5. Separate broken checks from broken services. If a step fails because a page element moved, the service is fine and the script needs fixing. Good tools label assertion failures separately from timeouts and errors; send each to a different place.
6. Group synthetic alerts with related ones. When checkout fails, you'll often see a synthetic alert, a backend error alert and a database alert at the same time. Alert correlation turns them into one incident, so the on-call engineer sees the user impact and the likely cause together.
7. Silence checks during planned work. Schedule maintenance windows for the checks that will fail during a deploy or migration, and end them automatically.
8. Connect to your status page. A confirmed failure of a customer-facing journey is usually the first sign you need a status page update. Treat it as a prompt for the communications lead.
9. Measure the false alarm rate. Track how many synthetic pages needed no action. If it's more than a small share, fix or retire those checks. Noisy checks are a common source of alert fatigue.
Synthetic monitoring metrics and SLOs
Metric | How it's calculated | What it tells you |
|---|---|---|
Check availability | Passed runs ÷ total runs × 100 | How often a journey worked, from the outside |
Response time | Time to complete the check, usually as a median and 95th percentile | How fast the journey is, and whether it's getting slower |
Step timing | Time per step in a transaction | Which step got slow: login, search or payment |
Failure type | Timeout, error code, failed assertion, script error | Whether the service or the check is broken |
Time to detect | First failed run to confirmed alert | How quickly synthetic monitoring warns you |
Can synthetic checks be an SLI? Yes, with care. A check running every minute from 3 regions makes 4,320 runs a day, about 130,000 in 30 days. A 99.9% target allows roughly 130 failed runs in that window. Synthetic SLIs work especially well for low-traffic services and for journeys that cross third-party systems, where request-based measurement is thin.
Their weakness is that they measure a robot, not your users. For high-traffic services, base the main SLO on real requests, and use synthetic availability as a second, independent signal. The difference between the two numbers is often where problems hide. For how availability, reliability and recovery fit together, see reliability vs availability.
Synthetic monitoring tools
Synthetic monitoring software falls into five broad groups:
Category | Examples | Best for |
|---|---|---|
Observability platforms with synthetics built in | Datadog, Dynatrace, New Relic, Splunk, Elastic, Grafana Cloud | Teams that want synthetic results next to their metrics, logs and traces |
Developer-first, monitoring as code | Checkly | Engineering teams that write browser checks with Playwright and keep them in version control |
Uptime-focused tools | Pingdom, UptimeRobot, Better Stack | Simple, affordable uptime and transaction checks |
Network synthetic monitoring | Cisco ThousandEyes, Kentik | Testing paths across the internet, cloud providers and internal networks |
Open source | Grafana k6, Uptime Kuma, Gatus, Playwright scripts | Teams willing to host and maintain checks themselves |
Products and plans change often; check each vendor's current features before you buy.
What to look for in a synthetic monitoring tool:
Browser and API checks, with multi-step scripting.
Enough probe locations near your users, plus private locations for internal apps.
Retries and multi-location confirmation before alerting.
Screenshots or recordings of failures, to tell broken scripts from broken services.
Pricing you can predict: browser checks are usually billed per run, so frequency and locations multiply the cost.
A clean way to send alerts into your on-call and incident tooling.
Where ITOC360 fits
ITOC360 doesn't run synthetic checks. It handles what happens after a check fails, the part that decides whether a synthetic alert turns into a fast fix or an ignored page.
Receives synthetic alerts from the tools you use, including Datadog, Grafana, Checkly and Pingdom, through ITOC360 Alerting.
Groups them with related alerts, so a failed checkout journey and the backend errors behind it arrive as one incident.
Pages the right owner for the journey that failed and escalates automatically if nobody responds, through ITOC360 On-Call and its escalation policies.
Holds back expected failures during scheduled maintenance windows.
Keeps customers informed with a status page update started from the same incident.
Your synthetic tool finds the problem; ITOC360 makes sure someone acts on it.
Frequently asked questions
What is synthetic monitoring?
Synthetic monitoring tests websites, apps and APIs by running scripted checks against them on a schedule, from different locations, to confirm they're available, correct and fast, even when no real users are active.
What is meant by synthetic monitoring?
"Synthetic" means the traffic is created by the monitoring tool rather than by real users. The tool imitates a user, such as loading a page or completing a purchase, and reports whether it worked.
What is the difference between synthetic and real user monitoring?
Synthetic monitoring runs scripted checks on a schedule and works without traffic, so it catches outages early. Real user monitoring (RUM) measures what actual visitors experience, so it shows real-world performance but only when people are using the site.
What is the difference between synthetic and passive monitoring?
Synthetic, or active, monitoring creates its own test traffic. Passive monitoring observes the real traffic, logs and metrics already flowing through your systems. Synthetic is proactive but limited to what you script; passive is comprehensive but needs real traffic.
What is the difference between synthetic and real user monitoring?
Synthetic monitoring runs scripted checks on a schedule and works without traffic, so it catches outages early. Real user monitoring (RUM) measures what actual visitors experience, so it shows real-world performance but only when people are using the site.
What is the difference between synthetic and passive monitoring?
Synthetic, or active, monitoring creates its own test traffic. Passive monitoring observes the real traffic, logs and metrics already flowing through your systems. Synthetic is proactive but limited to what you script; passive is comprehensive but needs real traffic.
What is synthetic API monitoring?
It's running scheduled calls against an API, often several in sequence, and checking the status codes, response data and response time. It catches broken endpoints, authentication failures and slow responses.
How often should synthetic checks run?
Every 30 to 60 seconds for simple uptime and critical API checks, and every 5 to 15 minutes for browser journeys, which are more expensive to run.
What is the best synthetic monitoring software?
It depends on your stack. Teams already on an observability platform often use its built-in synthetics, developer teams often prefer monitoring-as-code tools such as Checkly, and smaller teams often start with uptime-focused tools such as Pingdom or UptimeRobot.
How do you avoid false alarms in synthetic monitoring?
Re-run failed checks before alerting, require failures from more than one location, separate broken scripts from broken services, and silence checks during planned maintenance.
Sources
Google SRE Book: Monitoring Distributed Systems (black-box and white-box monitoring)