IT Monitoring in 2026: What It Is, What to Monitor, and How to Make Alerts Count
Quick Answer
IT monitoring is the continuous collection and evaluation of data from your infrastructure, applications, and services to confirm they're available and performing as expected. When something drifts outside normal behavior, monitoring raises an alert so a person or an automated process can fix it before users notice.
Key Takeaways
IT monitoring answers two questions at all times: is it up? and is it working well enough?
A complete setup covers network, servers, applications, databases, cloud, endpoints, security signals, and the end-user experience. In 2026 it also covers AI workloads.
Frameworks like the Four Golden Signals, USE, and RED tell you what to measure, so you don't have to guess.
Detection is rarely the weak spot. In ITOC360's analysis of over one million alerts, 60–80% required no human action at all.
Monitoring is only finished when every alert has an owner, a severity, and an escalation path, and when the monitoring itself is monitored.
What Is IT Monitoring?
IT monitoring is the practice of watching the systems your business runs on (servers, networks, databases, applications, cloud services, and endpoints) and checking the data they produce against what "healthy" looks like.
You'll also see it called IT infrastructure monitoring or IT systems monitoring. The terms overlap heavily, although infrastructure monitoring usually refers only to the hardware and platform layers.
At its simplest, a monitoring tool asks a system a question every few seconds: Are you responding? How fast? How much memory are you using? How many requests are failing? It stores the answers, compares them to thresholds or historical baselines, and raises a flag when something looks wrong.
In ITIL 4, this work falls under the Monitoring and Event Management practice. ITIL sorts every event into one of three classes:
Informational events are logged for reference only.
Warning events signal a trend worth watching.
Exception events mean something is broken and needs action.
That simple classification is still one of the best ways to decide what should wake someone up. (New to the framework? See ITSM vs ITIL.)
The practical definition is shorter: IT monitoring exists so your team finds out about problems before your customers do. If a signal doesn't help you detect, diagnose, or prevent a problem, it's just storage cost.
Types of IT Monitoring
Modern environments are layered, and a failure at any layer can take a service down. Here are the main types and what each one watches.
Type | What it watches | Example signals |
|---|---|---|
Network monitoring | Routers, switches, firewalls, links | Latency, packet loss, bandwidth, interface errors |
IT infrastructure monitoring (servers and hosts) | Physical hosts, VMs, storage | CPU, memory, disk I/O, uptime. See server monitoring |
Container and Kubernetes monitoring | Pods, nodes, clusters | Restarts, pending pods, resource limits |
Application performance monitoring (APM) | Services, APIs, background jobs | Request rate, error rate, response time, traces |
Database monitoring | SQL and NoSQL stores, caches | Query latency, connections, replication lag |
Cloud monitoring | AWS, Azure, GCP resources and SaaS dependencies | Service health, quotas, spend anomalies |
Log monitoring | Application and system logs | Error patterns, unusual events |
Endpoint monitoring | Laptops, desktops, mobile devices | Patch status, disk health, agent status |
Security monitoring | Access, traffic, and endpoints | Failed logins, unusual outbound traffic |
End-user experience monitoring | What customers actually see | Page load time, synthetic checks, real-user errors |
Business activity monitoring | Business outcomes | Checkouts per minute, signups, API calls per customer |
AI workload monitoring | LLM calls, AI agents, GPU resources | Token usage, cost per request, time to first token, provider errors |
Two notes on this list:
Security monitoring usually belongs to a security team using SIEM and EDR tools. Operations teams still need to see its signals, because a spike in failed logins can look exactly like an outage from the outside.
Business activity monitoring is the most underrated type. A dashboard can be all green while checkouts silently drop to zero. Monitoring a business metric catches failures that no technical check was designed for.
Monitoring AI Workloads: The New Layer in 2026
If your product calls an LLM or runs AI agents, you have a dependency that behaves differently from anything else in your stack. It's slower, costs money per request, and fails in unfamiliar ways: rate limits, timeouts, and responses that are technically successful but useless.
A basic AI monitoring setup tracks:
Latency, especially time to first token, which is what users feel.
Token usage and cost per request, per feature, and per customer. Runaway loops in AI agents can burn through a monthly budget in hours.
Provider errors and rate-limit responses from the model API.
GPU utilization and queue depth if you host models yourself.
The good news is that you don't need a separate tool category. OpenTelemetry now defines semantic conventions for generative AI, so AI calls can flow into the same pipeline as the rest of your telemetry. Major observability vendors, including Grafana, launched dedicated AI observability features in 2026.
IT Monitoring vs. Observability vs. Alerting vs. IT Management
These terms get mixed up constantly. Here's how they differ.
Term | What it answers | Scope |
|---|---|---|
IT monitoring | "Is anything I know to watch for going wrong?" | Predefined metrics, checks, thresholds |
Observability | "Why is this happening, even if I've never seen it before?" | Exploring metrics, logs, and traces to debug unknown problems |
IT alerting | "Who needs to know, and how fast?" | Turning signals into notifications. See what IT alerting is |
NOC monitoring | "Who is watching around the clock?" | A team and operating model. See NOC monitoring |
IT management | "How do we run, change, and improve these systems?" | The broader discipline monitoring feeds into. See what ITSM is |
Google's DORA research puts the monitoring/observability line well. Monitoring relies on metrics and logs you decided on in advance, while observability lets you explore patterns you didn't anticipate. (DORA) You need both: monitoring catches the failures you expected, and observability helps you investigate the ones you didn't. For the three pillars and a side-by-side comparison, see our guide to observability vs monitoring.
How IT Monitoring Works
Every monitoring system follows the same loop.
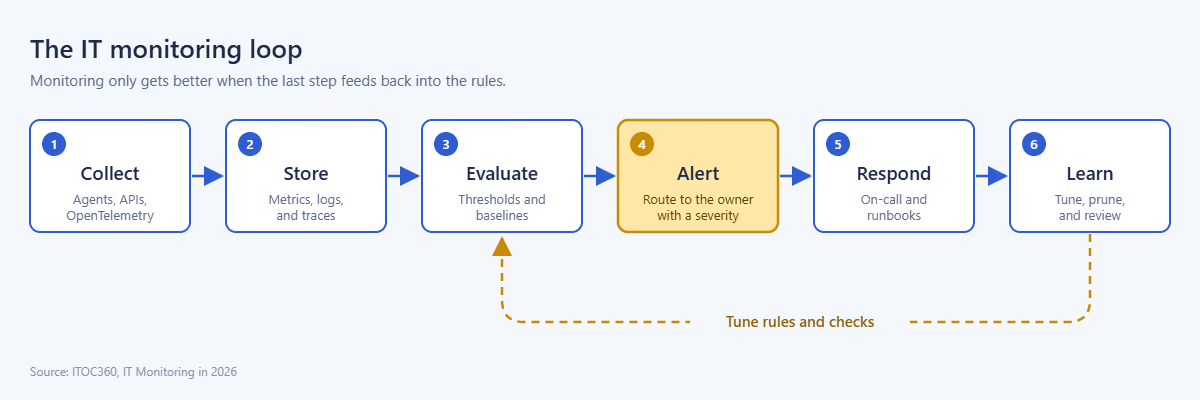
The loop only improves over time if the last step feeds back into how alerts are evaluated.
1. Collect. Data comes in through agents on hosts, agentless protocols like SNMP or WMI, cloud provider APIs, or telemetry emitted by the application itself. OpenTelemetry has become the vendor-neutral standard for instrumenting applications, which makes it far easier to switch tools later.
2. Store. Metrics go into a time-series database, logs into a searchable index, and traces into a tracing backend. Retention settings drive both cost and your ability to spot slow trends.
3. Evaluate. Rules compare incoming data against static thresholds ("disk above 90%") or dynamic baselines ("latency is three times higher than a normal Tuesday afternoon").
4. Alert. When a rule fires, the system creates an alert. This is where monitoring hands off to alert routing, on-call schedules, and escalation.
5. Respond. A human or an automated runbook investigates and fixes the issue, following your incident response lifecycle.
6. Learn. After the incident, the team tunes thresholds, adds missing checks, and removes alerts that didn't help. Track those fixes as postmortem action items so they actually get done. Skip this step and your monitoring slowly rots.
Most monitoring guides stop at step 4. In practice, steps 4 through 6 decide whether monitoring actually reduces downtime.
What to Measure: Three Frameworks That Work
The hardest question in monitoring isn't how to collect data. It's what to collect.
Framework | Best for | What it measures |
|---|---|---|
Four Golden Signals | User-facing services | Latency, traffic, errors, saturation |
USE Method | Infrastructure resources | Utilization, saturation, errors |
RED Method | Microservices and APIs | Rate, errors, duration |
The Four Golden Signals come from Google's Site Reliability Engineering book. The USE Method was created by performance engineer Brendan Gregg for hardware and host resources. RED is a lighter take on the golden signals for request-driven services.
A simple rule of thumb: use USE for the things your services run on, and RED or the Golden Signals for the services themselves. Add one or two business metrics per critical service, and you've covered most of what matters.
Monitoring Approaches and Trade-Offs
Agent-based vs. agentless. Agents give deep, high-frequency data from inside a host but need installing and patching. Agentless monitoring (SNMP, API polling) is quicker to roll out, especially for network gear, but offers less detail.
Black-box vs. white-box. Black-box checks test a system from the outside, the way a user would. White-box monitoring uses internal metrics, logs, and traces. Black-box tells you that something is broken, and white-box tells you why.
Synthetic vs. real-user monitoring. Synthetic checks run scripted transactions on a schedule, so they catch problems at 3 a.m. when no one is online. Real-user monitoring captures what actual visitors experience across devices and locations.
Real-time vs. historical. Real-time monitoring tells you what's happening now. Historical trend analysis shows slow problems, like a memory leak that grows 2% a day, and feeds capacity planning and SLA reporting.
Static thresholds vs. anomaly detection. Static thresholds are predictable and easy to reason about. Anomaly detection adapts to seasonality and growth but needs good history and time to earn engineers' trust.
Reactive vs. proactive. Reactive monitoring responds once something breaks. Proactive monitoring looks for early warning signs, like rising latency or a disk trending toward full, and acts first. Most mature teams aim for proactive but keep reactive checks as a safety net.
Why IT Monitoring Matters
Downtime is still expensive. Uptime Institute's 2026 outage analysis found that 57% of respondents said their most recent major outage cost over $100,000. For the second year in a row, 1 in 5 reported costs above $1 million. (Uptime Institute) For how those costs add up, see what downtime is and how to reduce it.
The same research points to a shift in where failures come from. Outage risk is moving away from operator mistakes and toward software behavior, updates, and the way components interact. (Uptime Institute 2026 report) That's exactly what monitoring is built to watch.
Beyond preventing outages, good monitoring gives you:
Faster recovery. You can't reduce MTTR until you know something is broken. Detection is the first chunk of every outage.
Proof for SLAs and audits. Monitoring data is the evidence behind every uptime promise, and it's what auditors ask for. See SLA vs SLO vs SLI.
Cost control. Utilization data exposes idle servers, oversized cloud instances, and runaway AI spend.
Capacity planning. Trend data shows when you'll run out of disk, memory, or budget, long before you do.
Better root cause analysis. Historical data turns RCA from guesswork into evidence.
For what happens when monitoring misses something, see our guide to IT outages. If the same incident keeps coming back, faster response isn't enough; that's a job for problem management.
Common IT Monitoring Challenges
Alert noise. This is the big one. When we analyzed more than one million alerts across production environments, we found that 60–80% required no human action (ITOC360 internal analysis, 2026): duplicates, downstream symptoms of one root cause, or blips that resolved themselves. Grafana Labs' 2026 Observability Survey again found alert fatigue to be the single biggest obstacle to faster incident response. Over time, that noise is also a leading driver of on-call burnout.
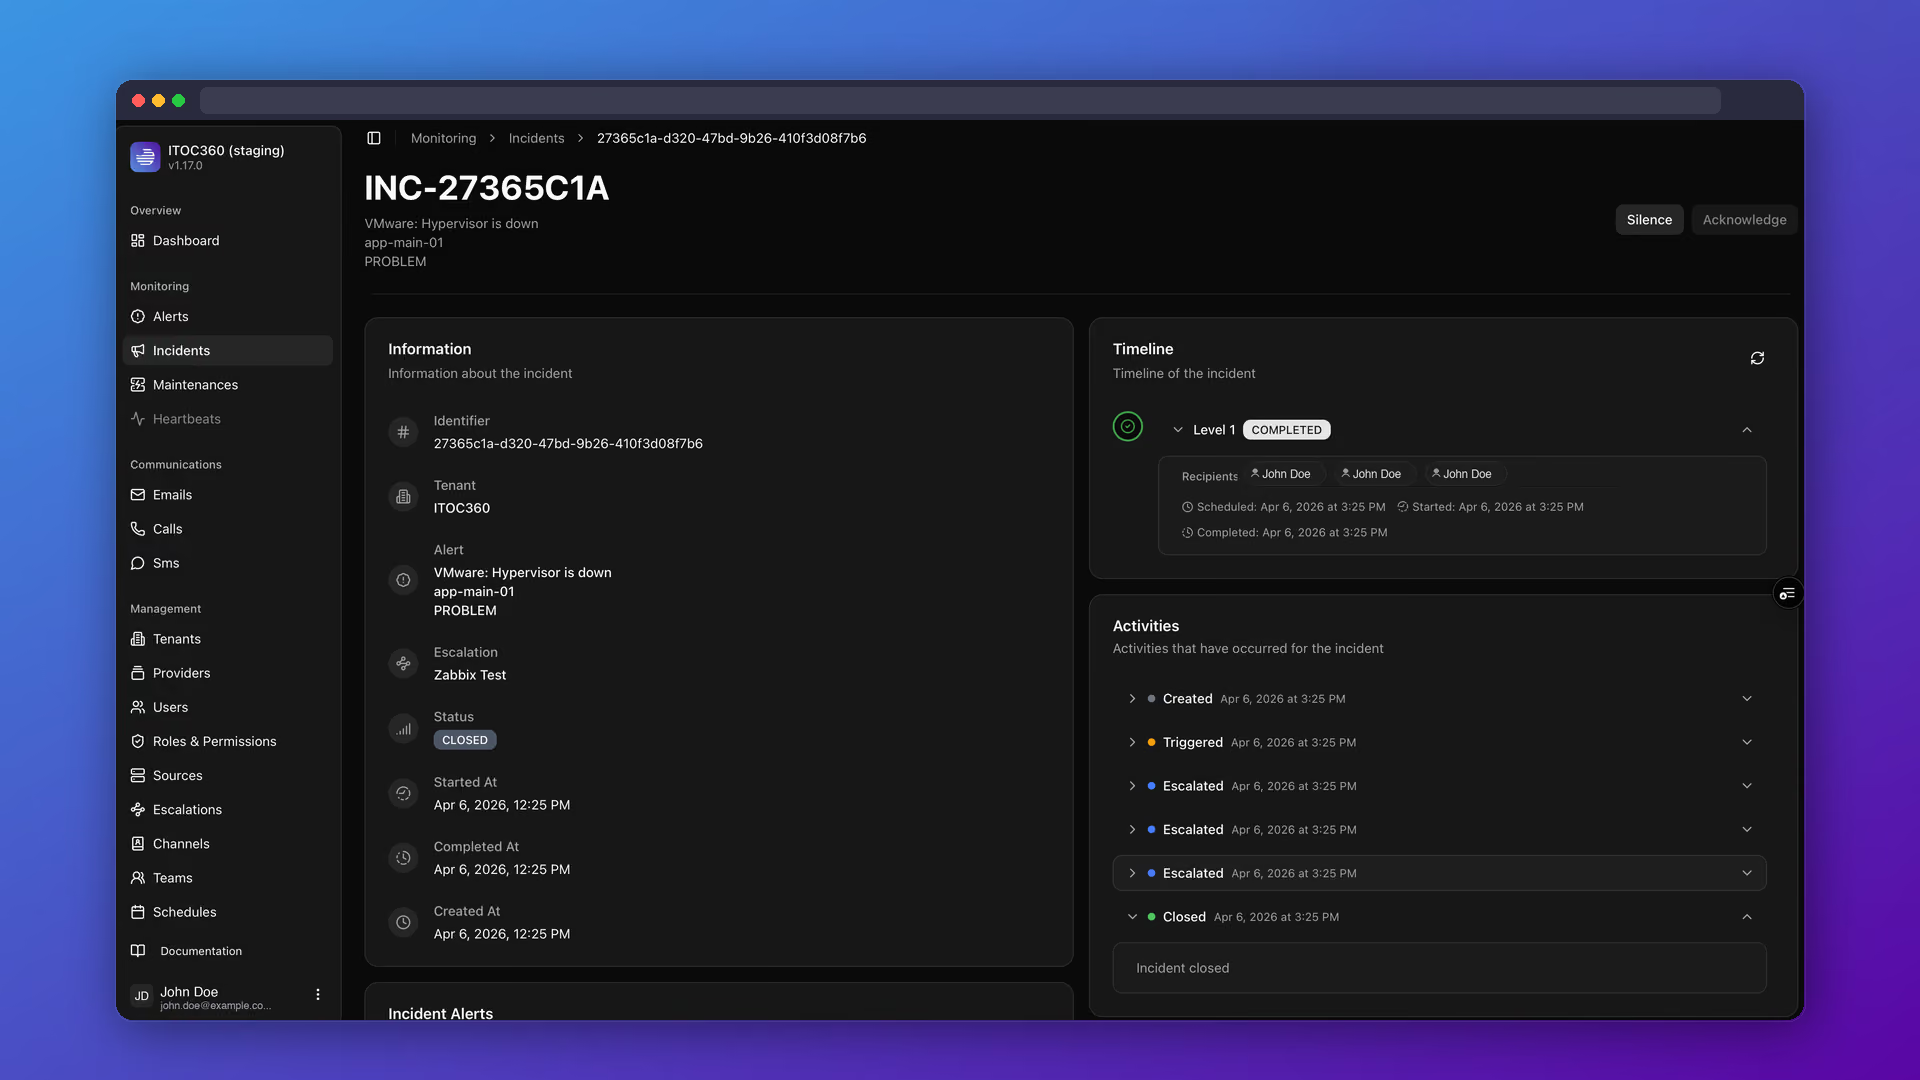
This is the layer ITOC360 is built for. It sits between your monitoring tools and your responders, grouping duplicate alerts into a single incident and routing it to whoever owns the service.
Complexity and tool sprawl. In the same survey, practitioners ranked complexity and overhead as their top concern (38%), ahead of signal-to-noise (34%) and cost (31%). Every new tool adds another dashboard, another alert source, and another login.
Hybrid and multi-cloud blind spots. Each cloud provider has its own native monitoring, and on-prem tools often weren't built for autoscaling or serverless. The gaps sit between environments.
Legacy systems. Older hardware and software may not expose modern telemetry, so teams end up relying on basic up/down checks for critical systems.
Data volume and cost. Telemetry grows faster than infrastructure. Without retention policies and sampling, monitoring bills can grow faster than the systems they watch.
Missing context. An alert that says "CPU high" without naming the service, the customer impact, or a runbook forces the responder to start from scratch.
Silos. When infrastructure, application, and security teams each use different tools, no one sees the full picture during an incident.
We cover noise fixes in depth in what alert noise is and how to eliminate it.
Two Things Most Teams Forget to Monitor
1. Changes
Deployments, configuration changes, feature flags, and infrastructure updates cause a large share of incidents. Yet many monitoring setups don't record them at all.
The fix is simple: send a change event to your monitoring platform every time something ships, and overlay those events on your dashboards. When latency jumps at 14:02 and a deploy went out at 14:01, the root cause investigation takes minutes instead of hours. Our release management best practices cover how to make deploys safer in the first place.
2. The monitoring itself
What happens if your monitoring agent crashes, a scrape target disappears, or the alert pipeline breaks? Usually, nothing, and that's the problem. A silent monitoring failure looks exactly like a healthy system.
Protect against this with a heartbeat check (also called a dead man's switch). This is an alert that fires continuously and pages someone only when it stops arriving. Prometheus setups often include one called "Watchdog" for exactly this reason. For more on why silent failures are so dangerous, see why on-call teams are one silent alert away from disaster.
In ITOC360, you can set up a heartbeat monitor for any integration. If a monitoring source goes quiet for longer than expected, the on-call engineer gets paged, the same way they would for a real outage.
The IT Monitoring Maturity Model
Use this to see where your team is today and what the next step looks like.
Level | What it looks like | Next step |
|---|---|---|
1. Reactive | Users report problems before your team knows | Add basic uptime checks for critical services |
2. Basic | Up/down checks and a few static thresholds | Instrument with Golden Signals or USE, and assign owners |
3. Proactive | SLOs defined, alerts have owners and severities, on-call is structured | Add change events and correlation |
4. Predictive | Baselines, anomaly detection, correlated alerts, change-aware dashboards | Automate safe remediation for known issues |
5. Autonomous | Routine issues fix themselves, and humans review anything new or risky | Keep reviewing noise and automation outcomes |
Most organizations sit at level 2 or 3. Moving up a level usually comes from improving process (ownership, severity, review), not from buying a new tool.
How to Build an IT Monitoring Strategy in 8 Steps
1. Start with what customers depend on. List your critical user journeys (login, checkout, key API calls) and the services behind them. Monitor these first.
2. Define what "healthy" means. Set service level objectives, such as "99.9% of API requests succeed in under 300 ms." SLOs give every alert a clear purpose.
3. Instrument every layer. Apply USE to infrastructure and RED or the Golden Signals to services. Add synthetic checks for your top journeys and at least one business metric per critical service.
4. Alert on symptoms, not causes. Page someone when users are affected. Send cause-level signals like "CPU at 85%" to dashboards or tickets instead of waking someone up.
5. Give every alert an owner and a severity. No alert goes live without a named team, a severity level, and a runbook link.
6. Connect monitoring to on-call. Route alerts by service and severity, and set escalation policies for unacknowledged alerts. The Google SRE Workbook is a solid guide to keeping on-call load sustainable, and our on-call best practices guide covers rotations and burnout. Need a starting point? Use our on-call schedule template.
If you're doing this in spreadsheets and Slack threads today, an on-call platform like ITOC360 handles schedules, routing, and escalation in one place. It integrates with Prometheus, Datadog, New Relic, Grafana, Zabbix, and dozens of other monitoring tools.
7. Record changes and add a heartbeat. Send deploy and config events to your monitoring platform, and set up a dead man's switch so a broken pipeline can't fail silently.
8. Review and prune monthly. For every rule that fired, calculate its noise score: the share of firings that led to no meaningful action. Tune or retire the noisiest rules first. Track MTTD, MTTA, and MTTR alongside other incident management KPIs to confirm things are improving. MTTD is the one monitoring changes most directly.
IT Monitoring Tools by Category
No single piece of IT monitoring software does everything well. Most teams combine a few IT monitoring tools from these categories.
Category | What it covers | Examples |
|---|---|---|
Infrastructure and network | Hosts, devices, SNMP, availability | Zabbix, Nagios, PRTG, SolarWinds |
Metrics and dashboards | Time-series metrics, visualization | Prometheus, Grafana |
Full-stack observability / APM | Traces, app performance, infrastructure | Datadog, Dynatrace, New Relic |
Cloud-native | Provider-specific resources | Amazon CloudWatch, Azure Monitor, Google Cloud Monitoring |
Logs | Search and analysis of log data | Elastic, Splunk, Grafana Loki |
Endpoint / RMM | Devices, patches, remote support | RMM platforms used by IT teams and MSPs |
Alerting and incident response | Routing, on-call, escalation | On-call and incident response tools |
When comparing options, ask these questions:
Question | Why it matters |
|---|---|
Does it cover your full environment (on-prem, cloud, containers, SaaS, AI)? | Blind spots become outages |
Does it support OpenTelemetry? | Reduces lock-in |
How does pricing scale with hosts, metrics, or data volume? | Costs can outgrow your infrastructure |
Can it correlate and deduplicate alerts? | Determines how much noise reaches people |
Does it integrate with your on-call and incident tools? | Detection without routing just moves the problem |
How long does it keep data? | Short retention hides slow trends |
For independent user reviews, Gartner Peer Insights is a useful starting point. For the response side of the stack, see our enterprise incident management software guide.
IT Monitoring Trends to Watch
AI that explains, not just detects. Grafana's 2026 survey found 92% of practitioners see value in AI that surfaces anomalies before they cause downtime. The catch: practitioners want AI they can verify. In our experience, the setups that work pair rules with machine learning, and engineers review suggestions before anything changes automatically. (More on this in what AIOps is.)
The shift to SaaS. Half of the Grafana survey's respondents now use SaaS for observability in some form. That's up from 42% the year before.
Open standards everywhere. OpenTelemetry is becoming the default way to instrument, which makes the monitoring backend easier to swap.
Monitoring AI itself. As AI agents take on real work, their cost, latency, and failure modes become part of core IT monitoring, not a side project.
Frequently asked questions
What is IT monitoring in simple terms?
IT monitoring means continuously checking that your technology is running properly. Software collects data from servers, networks, and applications, compares it to what normal looks like, and alerts your team when something goes wrong.
What are the main types of IT monitoring?
The main types are network, server and infrastructure, application performance (APM), database, cloud, container, log, endpoint, security, end-user experience, and business activity monitoring. Teams running AI features now add AI workload monitoring too.
What is IT infrastructure monitoring?
IT infrastructure monitoring is the part of IT monitoring that watches the underlying hardware and platforms: servers, virtual machines, storage, networks, and cloud resources. It tracks signals like CPU, memory, disk, and uptime, while application and end-user monitoring cover the layers above it.
What should I look for in IT monitoring software?
Look for coverage of your whole environment, OpenTelemetry support, predictable pricing as data grows, alert correlation and deduplication, and integrations with your on-call and incident tools. Data retention matters too, because short retention hides slow-moving trends.
What is the difference between IT monitoring and observability?
IT monitoring tracks predefined metrics and alerts when they cross known thresholds. Observability is the ability to investigate problems you didn't anticipate by exploring metrics, logs, and traces together. Monitoring tells you something is wrong, and observability helps you understand why.
What is the difference between IT monitoring and IT management?
IT monitoring observes systems and detects problems. IT management is the broader discipline of running, changing, and improving those systems. Monitoring provides the data that IT management decisions depend on.
What metrics should IT monitoring track?
Start with the Four Golden Signals for user-facing services (latency, traffic, errors, saturation) and the USE method for infrastructure (utilization, saturation, errors). Add a business metric, like successful checkouts, for each critical service.
How do you reduce noise in IT monitoring?
Alert on user-facing symptoms rather than internal causes, group related alerts from the same root cause, suppress alerts during planned maintenance, and review each rule's noise score monthly. Rules that rarely lead to action should be tuned or removed.
Can IT monitoring help with compliance audits?
Yes. Monitoring data provides timestamped evidence of availability, incidents, response times, and security events. Auditors commonly request exactly this for SLA, SOC 2, and industry-specific reviews.
Is IT monitoring the same as NOC monitoring?
No. IT monitoring is the practice and the tooling. NOC monitoring describes a team, the Network Operations Center, that watches those tools around the clock. Many teams run effective IT monitoring without a dedicated NOC, using automated routing and on-call rotations instead.
Conclusion
IT monitoring is the foundation of reliable systems, but collecting data is the easy part. The teams that actually prevent outages measure the right things, record every change, alert only when a human needs to act, and make sure every alert reaches someone who owns it. They also check that the monitoring itself is still alive.
If your monitoring catches problems but your team is still slow to respond, the gap probably isn't in your monitoring tools. It's in what happens after the alert fires.
Turn monitoring alerts into fast, accountable response. ITOC360 connects your monitoring tools to on-call schedules, smart routing, and automatic escalation, so the right engineer hears about the right problem at the right time.