








Every minute your service is down, you’re losing money, trust, and momentum. In 2026, the speed at which IT teams detect, diagnose, and fix failures defines not just system performance but business survival. This guide breaks down everything you need to know about MTTR-what it actually means, how to calculate it, what good looks like, and the practices that separate high-performing incident management teams from the rest.
Quick Answer: What Is MTTR and Why It Matters in 2026
MTTR stands for Mean Time to Repair (or Mean Time to Recovery, depending on context). In IT operations, it measures the average time from the moment an alert system flags a system failure to the moment normal operations are fully restored. MTTR is a key performance indicator for incident management, DevOps, SRE, and any team running services that need to stay up around the clock.
A lower MTTR indicates faster recovery from incidents-and a direct reduction in revenue loss, SLA breach risk, and damage to customer satisfaction.
The business impact is concrete. If your critical payments API goes down for 45 minutes during peak hours, your MTTR is 45 minutes, and your revenue loss can reach tens of thousands of dollars. Telecom case studies have shown average revenue losses ranging from $182,000 to $273,000 per month from repeated incident effects.
ITOC360 is an AI-driven incident orchestration platform designed to help teams lower MTTR by correlating alerts from dozens of monitoring tools, routing incidents to the right engineer, and automating escalation when response time targets are at risk.
MTTR Definitions: Repair, Recovery, Respond, Resolve
When discussing MTTR in incident management, you’ll quickly find that the acronym is overloaded. MTTR can mean repair, recovery, respond, or resolve, and each variant measures something different. Before your team sets targets or reports numbers, everyone needs to be on the same page about which definition you’re using.
Here are the four main variants:
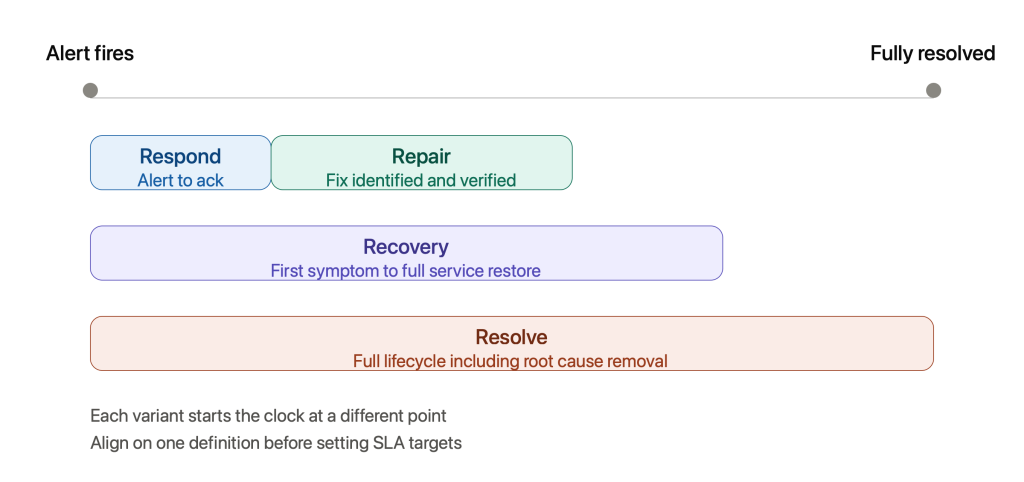
- Mean Time to Repair: The time from when a failed component is identified to when the technical fix is complete and verified. MTTR focuses here on the repair processes themselves-patching code, replacing hardware, deploying updates. MTTR includes time for diagnosis, repair, and testing.
- Mean Time to Recovery: The time from the first user-facing symptom or alert to full service restoration. Mean time to recovery measures time to restore service after failure, including failover, rollback, and stabilization-not just the technical fix.
- Mean Time to Respond: The time from alert to the start of incident response work. This is closely related to MTTA and tells you how fast your team picks up and begins investigating.
- Mean Time to Resolve: The full incident lifecycle from detection to confirmed resolution. Mean time to resolve includes time spent ensuring issues won’t recur-root cause removal, cleanup, and prevention.
This article primarily emphasizes mean time to repair and mean time to recovery, referencing the others where relevant.
If your teams aren’t aligned on which variant they’re using, your KPIs and service level agreements become misleading. One team might count only the “repair” window, while another includes rollback decision time and verification. That discrepancy can make a 30-minute MTTR look like a 90-minute one.
Key Incident Management Metrics Around MTTR
An IT incident is any unplanned disruption to business operations-500 errors flooding an API, a major latency spike in a checkout flow, or a security breach exposing customer data. MTTR is one of several key metrics used in modern incident management and site reliability engineering, and it rarely tells the full story on its own.
Here are the other key metrics you need alongside MTTR:
| Metric | What It Measures |
|---|---|
| MTTD (Mean Time to Detect) | How quickly monitoring surfaces an issue. Mean Time to Detect measures how long it takes to notice an incident. |
| MTTA (Mean Time to Acknowledge) | How quickly on-call teams pick up an alert. MTTA measures time from alert to acknowledgment of an issue. |
| MTBF (Mean Time Between Failures) | Average uptime between repairable failures. MTBF measures the average time between repairable failures. |
| MTTF (Mean Time to Failure) | Average lifespan before failure for non-repairable components. MTTF should be high for non-repairable systems. |
| Failure Rate | Number of failures in a given period (e.g., incidents per month). |
Together, MTTR, MTTD, MTTA, MTBF, and MTTF give a holistic view of system reliability and incident response. If MTTR remains high but MTTA is low, the bottleneck is likely in diagnosis or repair procedures, not in response time. ITOC360 focuses specifically on compressing MTTA and MTTR via intelligent alert routing, noise reduction, and automated incident workflows.
How to Calculate MTTR (Mean Time to Repair / Recovery)
Calculating MTTR consistently is critical for trend analysis, benchmarking, and SLA reporting. Without a standardized approach, you can’t tell whether process improvements are actually working.
The MTTR formula is straightforward:
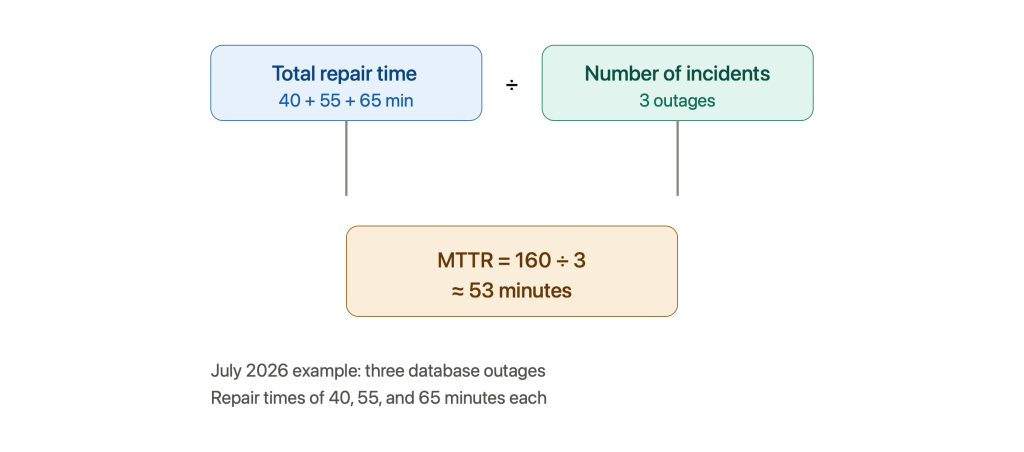
MTTR = Total time spent on repair or recovery in a specific period ÷ Number of incidents in that period
MTTR is calculated by dividing total repair time by incidents. The key question is when the clock starts and stops:
- For mean time to repair: the clock starts when the failure is detected and repair work begins, and stops when the technical fix is verified. MTTR includes time to detect, diagnose, repair, and verify fixes.
- For mean time to recovery: the clock starts at first customer-impacting symptom or alert, and stops when service is fully restored.
Concrete example: Suppose your team experienced three database outages in July 2026. Repair time for each was 40, 55, and 65 minutes. Total repair time = 160 minutes. Number of incidents = 3. MTTR = 160 ÷ 3 ≈ 53 minutes. That’s the average duration your team spent recovering from each outage. This is how you calculate MTTR with repair calculated from real incident data.
Practical complications to watch for:
- Time zones and business hours: For 24/7 services, count all hours. For business-hours-only systems, define whether weekends are included.
- Planned vs. unplanned downtime: Exclude planned maintenance; only count unplanned maintenance tasks and unplanned downtime.
- Multi-stage incidents: If a system outage degrades multiple services over time, clarify whether you measure first restoration or final restoration.
- Alert storms: Deduplicate so that one incident isn’t counted as many, which would inflate your numbers.
ITOC360 can automatically capture start/stop timestamps from monitoring and ticketing tools to standardize MTTR calculations across teams, removing manual guesswork from the process.
MTTR, Availability, Reliability, and Failure Rate
MTTR and system availability are directly connected through a simple formula:
Fast repair (1h)
99.90%
Slow repair (4h)
99.60%
Availability ≈ MTBF ÷ (MTBF + MTTR)
In plain terms: lower MTTR means less actual downtime per failure. Higher MTBF means fewer failures overall. Higher MTBF and lower MTTR improve system availability-improving both the availability and the user experience.
Here’s a concrete example. A payments service has an MTBF of 1,000 hours:
| Scenario | MTTR | Availability |
|---|---|---|
| Fast repair | 1 hour | 1,000 / 1,001 ≈ 99.90% |
| Slow repair | 4 hours | 1,000 / 1,004 ≈ 99.60% |
That difference-99.90% vs. 99.60%-translates to roughly 26 additional hours of downtime per year. For a payments API processing thousands of transactions per minute, that’s a significant hit to both system uptime and revenue.
But here’s the nuance: if your failure rate is climbing, even a lower MTTR won’t save you. Many short outages can be just as harmful to system reliability as fewer long ones. Teams need to track MTTR trends alongside failure rate to understand the full picture.
ITOC360’s alert correlation and incident timelines help teams see patterns in failure rate and MTTR across specific services or components, so you can identify which affected systems need the most attention.
Why Tracking MTTR Is Critical for IT Operations and Business Operations
Every unplanned system outage translates directly into measurable business operations risk: lost revenue, compliance violations, and brand damage that’s hard to reverse.
Here’s why tracking MTTR matters:
- Customer experience: Users expect always-on services. Higher MTTR negatively impacts user experience and satisfaction, especially in fintech, e-commerce, and healthcare where a lower MTTR reduces downtime and improves user experience.
- SLA compliance: Many contracts specify maximum resolution time for critical incidents. MTTR affects compliance with service level agreements, and exceeding targets triggers financial penalties or contract terminations. High MTTR on service requests and IT service delivery can be costly.
- Internal productivity: Prolonged outages stall sales, support, and logistics teams. MTTR over 5 hours can significantly reduce production efficiency across entire organizations and hurt job satisfaction for engineers stuck in extended war rooms.
- Security and regulatory risk: Longer exposure windows during IT incidents mean more time for attackers to exfiltrate data. Your security posture degrades with every extra minute of unresolved downtime.
- Cost reduction: A lower MTTR correlates with reduced downtime costs for businesses, helping avoid costly emergency repairs and minimizing the blast radius of each incident.
Tracking MTTR can identify patterns in how teams recover from failures-which services consistently take longer, which on-call rotations struggle, and where lead time between detection and repair keeps growing. Many organizations start tracking MTTR across their IT environment before and after adopting an incident orchestration platform to demonstrate ROI at the board level. Lower MTTR becomes a key talking point in C-suite discussions about operational resilience and downtime reduction.
Factors That Increase MTTR in Modern IT Environments
A high MTTR indicates potential issues such as poor monitoring, insufficient automation, or structural gaps in your incident response process. MTTR can vary based on internal capabilities and external factors, so understanding which bottleneck dominates is the first step before you try to reduce MTTR.
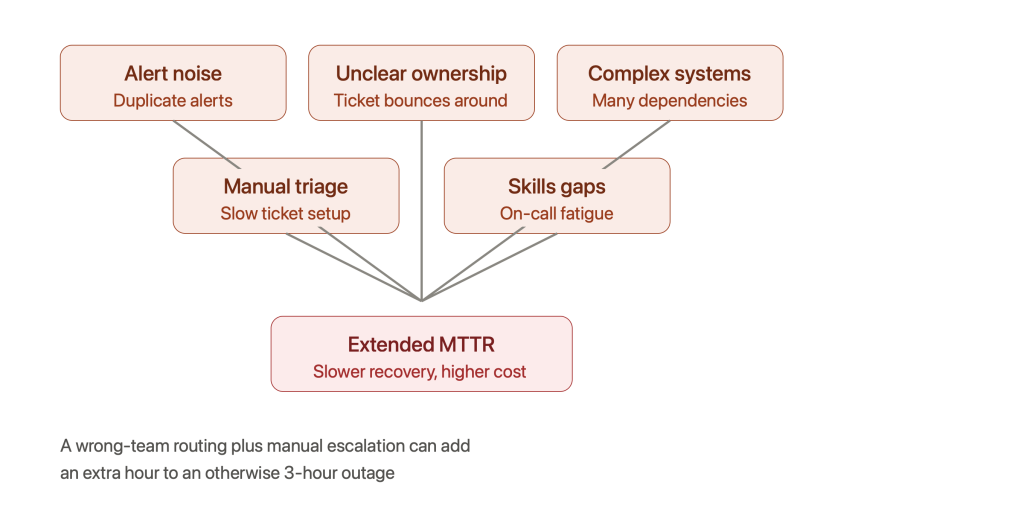
Common factors that inflate mean time to repair:
- Alert noise and false positives: Fragmented monitoring tools generate thousands of alerts, many of them duplicates. This creates alert fatigue and wastes engineering time on non-issues.
- Unclear ownership: When no one knows who owns a service or where the runbook lives, the fix request bounces between maintenance teams, adding 30-60 minutes of wasted response time.
- Complex architectures: Hybrid cloud, microservices, and multi-region deployments create many dependencies. Diagnosing root cause across layers-database, service mesh, infrastructure-is slow.
- Manual triage: Manually logging tickets, setting up conference bridges, and sending notifications all add time before anyone starts diagnosing.
- Skills gaps and on-call fatigue: Understaffed teams, engineers unfamiliar with specific IT systems, and repeated overnight shifts slow response and increase errors.
A real-world example: a 3-hour outage gets extended by an extra hour because the alert was routed to the wrong team, escalations were manual, and the engineer who finally picked it up had never seen that particular system failure before.
Understanding whether MTTA, diagnostic time, or change implementation is your largest MTTR component tells you where to invest. ITOC360 directly targets noise, ownership, and manual process issues via AI-based alert correlation and automated escalation policies.
Best Practices to Lower MTTR Across the Incident Lifecycle
Minimizing MTTR is an ongoing continuous improvement program, not a one-time optimization. The teams that sustain low MTTR treat incident resolution efficiency as a discipline. Improving MTTR enhances operational efficiency and resource allocation across the entire organization.
Here are the practices that move the needle:
- Standardize incident response: Create clear runbooks and decision trees for common failure modes. An incident response plan can lower MTTR by improving response times and giving responders a clear path from alert to resolution. Follow incident management best practices consistently.
- Improve observability: Invest in logs, metrics, and traces that pinpoint root cause quickly. Without strong telemetry, responders are guessing.
- Reduce manual work: Automate ticket creation, routing, and notifications. Every manual step is a delay.
- Train on-call engineers: Regular game days, simulations, and incident drills build muscle memory. Proactively testing system resilience improves reliability by uncovering hidden failures before they hit production.
- Post-incident reviews: Run blameless reviews focused on systemic MTTR reduction, not blame.
- Design for failure: Designing for failure improves reliability by preventing system-wide failures from individual ones-circuit breakers, retries, and graceful degradation all reduce impact.
- Use error budgets: Prioritizing reliability work using error budgets helps balance feature development with operational needs, so you develop strategies that don’t sacrifice stability.
Set realistic but ambitious MTTR targets by incident severity:
| Severity | Target MTTR (2026) |
|---|---|
| P1 (Critical) | < 60 minutes |
| P2 (Major) | < 4 hours |
| P3 (Minor) | < 1 business day |
Track progress monthly and measure pre- and post-change MTTR when rolling out new tools, automation, or team restructuring to see what’s actually working. Preventative maintenance and proactive process improvements can prevent future failures and reduce the frequency of such failures.
Monitoring, Alerting, and Incident Response: The Front Half of MTTR
MTTD and MTTA are tightly linked to MTTR because repair processes cannot start until incidents are detected and acknowledged. The front half of the incident lifecycle determines how quickly the back half can begin.
Modern monitoring tools like Prometheus, Grafana, Datadog, and New Relic generate massive volumes of alerts in real time. The challenge isn’t getting alerts-it’s getting the right ones to the right people. Establishing reliable monitoring and actionable alerts is vital for reducing MTTR, and monitoring and alerting can significantly reduce MTTR when properly tuned.
What matters most:
- Well-tuned alert thresholds: SLO-based alerting reduces noise. If your alert system’s effectiveness is low, you’re paging engineers for problems that don’t exist.
- Alert correlation: Correlating related alerts into a single incident avoids inflated MTTR and alert fatigue. Without correlation, one root cause can generate dozens of alerts that all look like separate incidents.
- Clear routing rules: The right on-call engineer needs to be paged for any given service, instantly.
Comprehensive observability combines metrics, structured logs, and distributed tracing to give responders the context they need. Unified telemetry helps eliminate delays caused by fragmented tools that force engineers to hop between dashboards during an outage.
ITOC360 ingests alerts from these monitoring platforms, groups them into meaningful incidents, and automatically routes them to the correct on-call rotation-reducing mean time to acknowledge and giving engineers a head start on diagnosis. Review alert configurations quarterly to keep pace with architecture and traffic changes in your IT environment.
Root Cause Analysis and Knowledge Management to Sustain Low MTTR
Sustainable MTTR improvement requires better diagnostics and institutional knowledge, not just faster paging. If you fix the same problem every month without addressing the root cause, your MTTR might be low on paper, but your failure rate stays high.
Root cause analysis helps minimize MTTR by preventing recurring issues. Structured RCA and post-incident reviews help teams:
- Identify recurring issues and fragile components that drive repeat incidents
- Improve runbooks and automation for known failure scenarios
- Reduce future diagnostic time for similar incidents
Techniques that work:
- Fault tree analysis (FTA): Visualize dependencies and failure paths to understand how one failed component cascades.
- Failure Modes and Effects Analysis (FMEA): Prioritize high-impact components for hardening and monitoring investment.
- Standardized templates: Consistent incident timelines and findings make pattern recognition easier.
Blameless post-mortems treat outages as learning opportunities rather than blame exercises-this is what separates teams that improve from teams that stagnate. Clear runbooks prevent responders from wasting time during outages. Incident runbooks maintain up-to-date remediation guides for known failure scenarios, reducing diagnosis time for each subsequent occurrence.
A centralized knowledge base should store past incident summaries with MTTR data, contributing factors, permanent fixes, service ownership, escalation paths, and executable runbooks. ITOC360 can attach historical incidents, notes, and runbooks directly to active incidents so engineers reuse proven solutions and further reduce mean time to repair.
Automation, AI, and Agentic ITOps: The Fastest Path to Lower MTTR
AI-driven and “agentic” IT operations are transforming incident response in large, real-time infrastructures. According to PagerDuty’s 2025 State of Digital Operations report, 53% of operations leaders view agentic AI as core to future IT operations. Reducing MTTR requires streamlining detection and automating workflows at every stage.
Specific ways automation and AI reduce MTTR:
- Automated enrichment: Collecting context-logs, configuration data, recent deployments-as soon as an incident is created so engineers skip the first 10 minutes of manual investigation.
- Automated remediation: Executing predefined scripts (restarting pods, failing over to replicas, flushing caches) on high-confidence patterns. Automating remediation can reduce resolution time and human error.
- Intelligent escalation: Predicting which team or specialist is needed based on incident history and current telemetry, preventing misroutes.
- Pattern recognition: Using historical incidents to suggest likely root causes and next best actions.
Utilizing modern technologies can enhance technician efficiency and reduce MTTR dramatically. A mid-sized MSP reduced MTTR from 47 minutes to 11 minutes-a 76.6% reduction-by deploying a digital network twin with agentic intervention, resolving two-thirds of routine incidents without human touch.
ITOC360, as an AI-focused incident orchestration platform, correlates multi-tool alerts into single incidents, assigns responsibility automatically to the right on-call engineer, and orchestrates escalations if SLAs for MTTA or MTTR thresholds are at risk.
Start with low-risk automated remediations-cache flushes, pod restarts, DNS failovers-and progressively expand as confidence grows. Don’t try to automate everything on day one.
Benchmarks: What Is a “Good” MTTR in 2026?
“Good” MTTR depends heavily on industry, system criticality, and architectural complexity. Copying a generic number without understanding your own baseline is a mistake.
Here are realistic benchmarks based on contemporary practices:
| System Criticality | P1 MTTR Target | Notes |
|---|---|---|
| Payments, trading, healthcare | < 30-60 minutes | Elite teams using GitOps report median MTTR of ~8 minutes for certain incident types |
| Standard B2B SaaS | 1-4 hours | Focus on critical incidents first, then expand |
| Internal line-of-business | Up to 1 business day | Lower priority, but still track for trends |
True leaders track MTTR separately by incident severity (P1, P2, P3), by service or business capability (checkout, login, analytics), and by incident type (infrastructure, application bug, security incident, third-party outage).
The data is clear that organizations reduce MTTR most effectively when they combine alert correlation, automated routing, and improved observability. An enterprise IoT platform (Xgrid) dropped MTTR from 42 minutes to 1.5 minutes-a 96.4% reduction-using unified observability and automated orchestration.
Establish your own baseline over 3-6 months, then aim for stepwise reductions of 20-30% per year. ITOC360 customers often see MTTR for noisy, multi-alert incidents cut by more than half once alert correlation and automated routing are in place.
MTTR and Cybersecurity: From Incident Response to Full Remediation
In cybersecurity, MTTR means something slightly different: it measures from detection of a threat to complete neutralization and recovery of affected systems. Security teams face unique challenges that inflate resolution time compared to standard operational incidents.
MTTR interacts closely with MTTD for attacks like ransomware, credential theft, and web application exploits. Slow detection or slow acknowledgment expands attacker dwell time, increasing data exfiltration risk and regulatory exposure. The security posture of any organization degrades with every minute a threat goes unaddressed.
Concrete cybersecurity MTTR challenges:
- Noisy SIEM alerts and high false positive rates create alert fatigue for SOC analysts
- Slow coordination between security, DevOps, and application teams when a breach spans multiple layers
- Manual containment and patching workflows that require approval chains before action
Lowering MTTR in security doesn’t just restore service-it minimizes downtime for users and limits the window for damage. ITOC360 serves as an incident orchestration hub for both IT and security incidents by grouping related security alerts into single incidents, ensuring the right security and engineering stakeholders are paged together, and automating escalations and status updates during active security incidents.
Using MTTR Data to Drive Continuous Improvement and Governance
MTTR isn’t just a dashboard number-it’s an input into process, tooling, and staffing decisions that shape operational efficiency over time.
Operations leaders and SRE managers can:
- Trend MTTR monthly and quarterly across teams and services to identify whether improvements are real vs. driven by fewer incidents.
- Correlate MTTR changes with new releases, platform migrations, or architectural changes. If MTTR spikes after a migration, that’s a signal worth investigating.
- Use MTTR and failure rate data in capacity planning: Justify more engineers on call, additional automation investments, or new observability tooling based on hard numbers.
Link MTTR to governance:
- Set explicit MTTR targets in SLAs and internal SLOs for each service tier
- Report MTTR to executives alongside system uptime and change failure rate as an incident management metric
- Include MTTR improvements as objectives in team OKRs
Platforms like ITOC360 provide analytics dashboards that break down MTTR stages-detection, acknowledgment, diagnosis, repair-to prioritize the biggest gains. Pair quantitative MTTR metrics with qualitative post-incident learnings to get a full picture of operational health. MTTR measures not just speed, but the maturity of your entire recovery process.
How ITOC360 Helps Teams Reduce MTTR in Practice
ITOC360 is an AI-centric incident orchestration platform built for DevOps, SRE, security, and IT operations teams managing large-scale, always-on systems. It’s designed from the ground up to compress every stage of the incident lifecycle.
Capabilities that directly impact MTTR and other key metrics:
- Alert correlation: Transforms noisy, duplicated alerts from multiple monitoring tools into single, meaningful incidents-eliminating the noise that inflates MTTR.
- Intelligent routing: Sends incidents to the most appropriate on-call engineer automatically, reducing mean time to acknowledge.
- Automated escalation: Escalates to secondary teams or managers if MTTA or MTTR thresholds are about to be breached.
- Contextual incident views: Aggregates logs, metrics, and recent changes so responders spend less time searching for data.
- Workflow automation: Triggers predefined remediation actions or runbooks from within the incident, minimizing downtime.
Example scenarios:
An e-commerce company was averaging 90-minute MTTR for checkout failures due to alert storms that overwhelmed their on-call rotation. After implementing alert correlation and automated routing via ITOC360, they cut average MTTR to 35 minutes-a 61% reduction. The team spent less time on triage and more time on actual repair.
A managed service provider used ITOC360 to reduce MTTR for network outages during overnight hours. Faster on-call engagement and automated escalation meant incidents that previously waited 20+ minutes for acknowledgment were picked up in under 3 minutes.
If you want to see how AI-driven incident management can lower MTTR in your own environment, request a demo of ITOC360 and start measuring the difference.
Conclusion: MTTR as a Strategic Lever for Reliable Digital Services
Here’s what to take away:
- MTTR (mean time to repair / mean time to recovery) is a central incident management metric for understanding and improving incident response, system availability, and system reliability. MTTR means the average time your team spends getting from failure to full restoration-and it’s one of the most important numbers in your IT operations toolkit.
- Reducing MTTR requires improved monitoring, clear ownership, automation, and disciplined post-incident learning. There are no shortcuts-but the right combination of practices and tooling delivers compounding returns.
- AI-powered incident orchestration platforms like ITOC360 enable teams to correlate alerts, lower noise, and automate response, directly shrinking MTTR across critical incidents.
- Organizations that treat MTTR as a strategic key performance indicator in 2026 will run more resilient, trustworthy digital services and protect their bottom line.
The role of AI and agentic ITOps in incident management is growing fast. But the fundamentals haven’t changed: measure your MTTR, understand where time is wasted, and systematically remove friction from every step of the incident lifecycle. The teams that do this consistently will deliver the system performance and reliability their users demand.